English vs Central American Male Poverty
COMPARE
English
Central American
Male Poverty
Male Poverty Comparison
English
Central Americans
10.3%
MALE POVERTY
96.4/ 100
METRIC RATING
80th/ 347
METRIC RANK
13.2%
MALE POVERTY
0.1/ 100
METRIC RATING
263rd/ 347
METRIC RANK
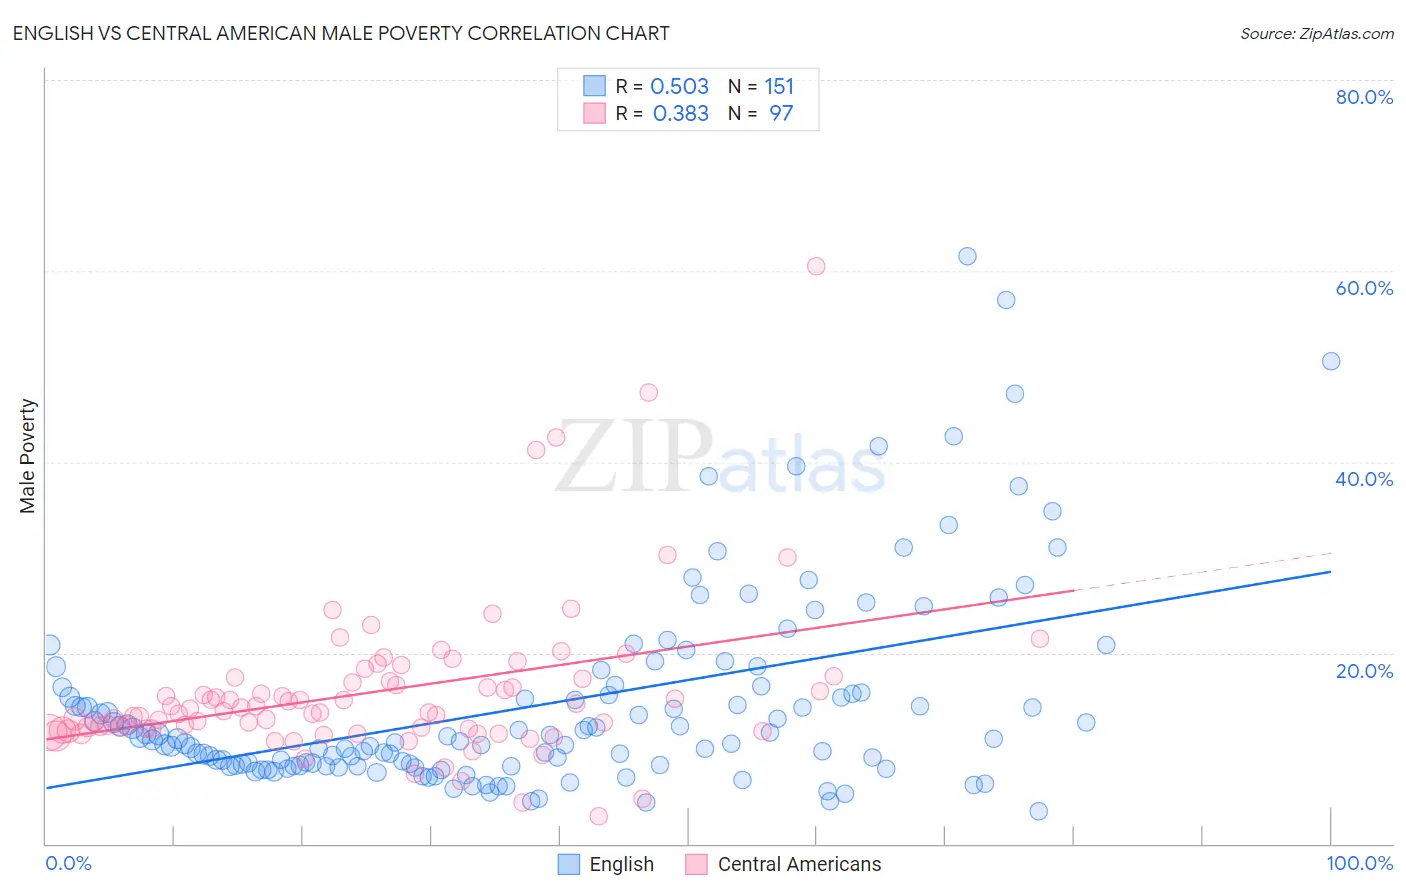
English vs Central American Male Poverty Correlation Chart
The statistical analysis conducted on geographies consisting of 577,651,479 people shows a substantial positive correlation between the proportion of English and poverty level among males in the United States with a correlation coefficient (R) of 0.503 and weighted average of 10.3%. Similarly, the statistical analysis conducted on geographies consisting of 503,856,624 people shows a mild positive correlation between the proportion of Central Americans and poverty level among males in the United States with a correlation coefficient (R) of 0.383 and weighted average of 13.2%, a difference of 28.0%.
Male Poverty Correlation Summary
| Measurement | English | Central American |
| Minimum | 3.5% | 2.9% |
| Maximum | 61.6% | 60.5% |
| Range | 58.1% | 57.6% |
| Mean | 14.6% | 15.9% |
| Median | 10.9% | 13.7% |
| Interquartile 25% (IQ1) | 8.2% | 12.0% |
| Interquartile 75% (IQ3) | 15.8% | 17.2% |
| Interquartile Range (IQR) | 7.7% | 5.2% |
| Standard Deviation (Sample) | 10.4% | 8.3% |
| Standard Deviation (Population) | 10.4% | 8.2% |
Similar Demographics by Male Poverty
Demographics Similar to English by Male Poverty
In terms of male poverty, the demographic groups most similar to English are Immigrants from North America (10.3%, a difference of 0.080%), Irish (10.3%, a difference of 0.32%), Immigrants from Belgium (10.3%, a difference of 0.34%), Dutch (10.2%, a difference of 0.37%), and Immigrants from Eastern Europe (10.2%, a difference of 0.38%).
| Demographics | Rating | Rank | Male Poverty |
| Immigrants | Asia | 97.0 /100 | #73 | Exceptional 10.2% |
| Immigrants | Eastern Europe | 96.9 /100 | #74 | Exceptional 10.2% |
| Carpatho Rusyns | 96.9 /100 | #75 | Exceptional 10.2% |
| Dutch | 96.9 /100 | #76 | Exceptional 10.2% |
| Immigrants | Belgium | 96.8 /100 | #77 | Exceptional 10.3% |
| Irish | 96.8 /100 | #78 | Exceptional 10.3% |
| Immigrants | North America | 96.5 /100 | #79 | Exceptional 10.3% |
| English | 96.4 /100 | #80 | Exceptional 10.3% |
| Belgians | 95.9 /100 | #81 | Exceptional 10.3% |
| Egyptians | 95.9 /100 | #82 | Exceptional 10.3% |
| Immigrants | Sweden | 95.7 /100 | #83 | Exceptional 10.3% |
| Czechoslovakians | 95.6 /100 | #84 | Exceptional 10.3% |
| Immigrants | England | 95.5 /100 | #85 | Exceptional 10.4% |
| Immigrants | Eastern Asia | 95.3 /100 | #86 | Exceptional 10.4% |
| Northern Europeans | 95.2 /100 | #87 | Exceptional 10.4% |
Demographics Similar to Central Americans by Male Poverty
In terms of male poverty, the demographic groups most similar to Central Americans are Iroquois (13.2%, a difference of 0.36%), Jamaican (13.2%, a difference of 0.38%), Spanish American Indian (13.1%, a difference of 0.40%), Trinidadian and Tobagonian (13.1%, a difference of 0.45%), and Ottawa (13.1%, a difference of 0.47%).
| Demographics | Rating | Rank | Male Poverty |
| Immigrants | Burma/Myanmar | 0.1 /100 | #256 | Tragic 13.0% |
| Immigrants | Trinidad and Tobago | 0.1 /100 | #257 | Tragic 13.1% |
| Cape Verdeans | 0.1 /100 | #258 | Tragic 13.1% |
| Cherokee | 0.1 /100 | #259 | Tragic 13.1% |
| Ottawa | 0.1 /100 | #260 | Tragic 13.1% |
| Trinidadians and Tobagonians | 0.1 /100 | #261 | Tragic 13.1% |
| Spanish American Indians | 0.1 /100 | #262 | Tragic 13.1% |
| Central Americans | 0.1 /100 | #263 | Tragic 13.2% |
| Iroquois | 0.1 /100 | #264 | Tragic 13.2% |
| Jamaicans | 0.1 /100 | #265 | Tragic 13.2% |
| Immigrants | Guyana | 0.1 /100 | #266 | Tragic 13.2% |
| Immigrants | Jamaica | 0.1 /100 | #267 | Tragic 13.3% |
| Sub-Saharan Africans | 0.1 /100 | #268 | Tragic 13.3% |
| Guyanese | 0.0 /100 | #269 | Tragic 13.3% |
| Cree | 0.0 /100 | #270 | Tragic 13.3% |