English vs Eastern European Median Male Earnings
COMPARE
English
Eastern European
Median Male Earnings
Median Male Earnings Comparison
English
Eastern Europeans
$55,747
MEDIAN MALE EARNINGS
77.4/ 100
METRIC RATING
149th/ 347
METRIC RANK
$66,472
MEDIAN MALE EARNINGS
100.0/ 100
METRIC RATING
16th/ 347
METRIC RANK
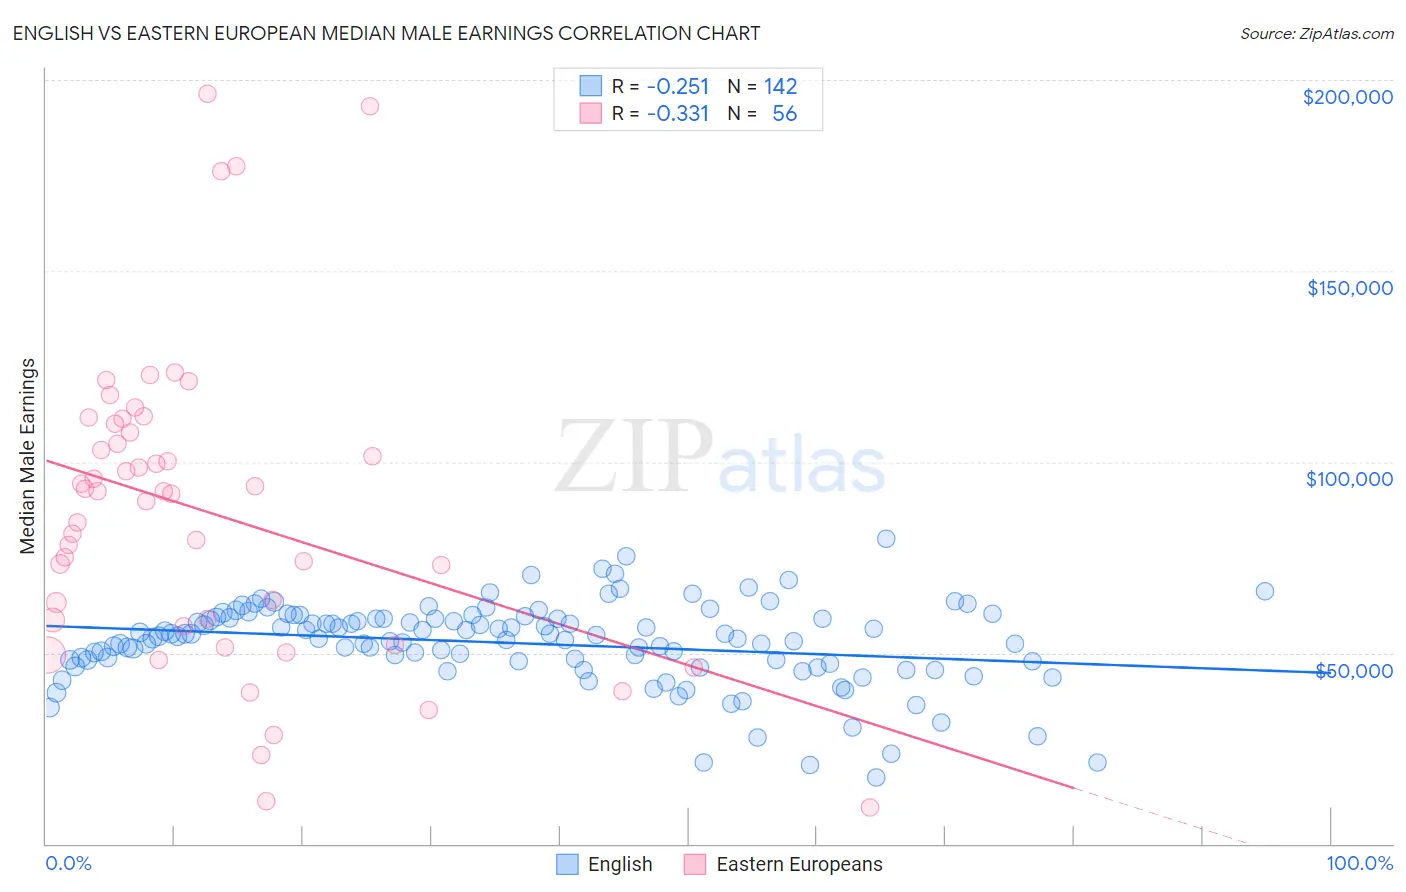
English vs Eastern European Median Male Earnings Correlation Chart
The statistical analysis conducted on geographies consisting of 577,846,764 people shows a weak negative correlation between the proportion of English and median male earnings in the United States with a correlation coefficient (R) of -0.251 and weighted average of $55,747. Similarly, the statistical analysis conducted on geographies consisting of 460,960,346 people shows a mild negative correlation between the proportion of Eastern Europeans and median male earnings in the United States with a correlation coefficient (R) of -0.331 and weighted average of $66,472, a difference of 19.2%.
Median Male Earnings Correlation Summary
| Measurement | English | Eastern European |
| Minimum | $17,188 | $9,364 |
| Maximum | $79,824 | $196,250 |
| Range | $62,636 | $186,886 |
| Mean | $52,541 | $86,901 |
| Median | $54,211 | $91,970 |
| Interquartile 25% (IQ1) | $47,796 | $57,711 |
| Interquartile 75% (IQ3) | $58,992 | $108,812 |
| Interquartile Range (IQR) | $11,196 | $51,101 |
| Standard Deviation (Sample) | $10,836 | $40,387 |
| Standard Deviation (Population) | $10,798 | $40,024 |
Similar Demographics by Median Male Earnings
Demographics Similar to English by Median Male Earnings
In terms of median male earnings, the demographic groups most similar to English are Swiss ($55,731, a difference of 0.030%), Immigrants from Oceania ($55,712, a difference of 0.060%), Scottish ($55,793, a difference of 0.080%), Immigrants from Philippines ($55,809, a difference of 0.11%), and Peruvian ($55,659, a difference of 0.16%).
| Demographics | Rating | Rank | Median Male Earnings |
| Ethiopians | 84.8 /100 | #142 | Excellent $56,243 |
| Sri Lankans | 83.4 /100 | #143 | Excellent $56,136 |
| Immigrants | Uganda | 82.4 /100 | #144 | Excellent $56,064 |
| Norwegians | 80.9 /100 | #145 | Excellent $55,965 |
| Immigrants | Chile | 80.7 /100 | #146 | Excellent $55,954 |
| Immigrants | Philippines | 78.4 /100 | #147 | Good $55,809 |
| Scottish | 78.2 /100 | #148 | Good $55,793 |
| English | 77.4 /100 | #149 | Good $55,747 |
| Swiss | 77.1 /100 | #150 | Good $55,731 |
| Immigrants | Oceania | 76.8 /100 | #151 | Good $55,712 |
| Peruvians | 75.8 /100 | #152 | Good $55,659 |
| Immigrants | Nepal | 75.0 /100 | #153 | Good $55,615 |
| Taiwanese | 73.9 /100 | #154 | Good $55,556 |
| Scandinavians | 73.4 /100 | #155 | Good $55,527 |
| Immigrants | Ethiopia | 71.6 /100 | #156 | Good $55,434 |
Demographics Similar to Eastern Europeans by Median Male Earnings
In terms of median male earnings, the demographic groups most similar to Eastern Europeans are Immigrants from Belgium ($66,125, a difference of 0.53%), Indian (Asian) ($66,078, a difference of 0.60%), Immigrants from Eastern Asia ($66,903, a difference of 0.65%), Okinawan ($67,232, a difference of 1.1%), and Immigrants from China ($67,353, a difference of 1.3%).
| Demographics | Rating | Rank | Median Male Earnings |
| Immigrants | South Central Asia | 100.0 /100 | #9 | Exceptional $68,960 |
| Immigrants | Israel | 100.0 /100 | #10 | Exceptional $68,716 |
| Immigrants | Ireland | 100.0 /100 | #11 | Exceptional $67,698 |
| Immigrants | Australia | 100.0 /100 | #12 | Exceptional $67,634 |
| Immigrants | China | 100.0 /100 | #13 | Exceptional $67,353 |
| Okinawans | 100.0 /100 | #14 | Exceptional $67,232 |
| Immigrants | Eastern Asia | 100.0 /100 | #15 | Exceptional $66,903 |
| Eastern Europeans | 100.0 /100 | #16 | Exceptional $66,472 |
| Immigrants | Belgium | 100.0 /100 | #17 | Exceptional $66,125 |
| Indians (Asian) | 100.0 /100 | #18 | Exceptional $66,078 |
| Cypriots | 100.0 /100 | #19 | Exceptional $65,549 |
| Immigrants | Japan | 100.0 /100 | #20 | Exceptional $65,518 |
| Immigrants | Sweden | 100.0 /100 | #21 | Exceptional $65,406 |
| Burmese | 100.0 /100 | #22 | Exceptional $65,236 |
| Immigrants | Korea | 100.0 /100 | #23 | Exceptional $65,079 |