English vs Immigrants from Central America Median Male Earnings
COMPARE
English
Immigrants from Central America
Median Male Earnings
Median Male Earnings Comparison
English
Immigrants from Central America
$55,747
MEDIAN MALE EARNINGS
77.4/ 100
METRIC RATING
149th/ 347
METRIC RANK
$45,538
MEDIAN MALE EARNINGS
0.0/ 100
METRIC RATING
323rd/ 347
METRIC RANK
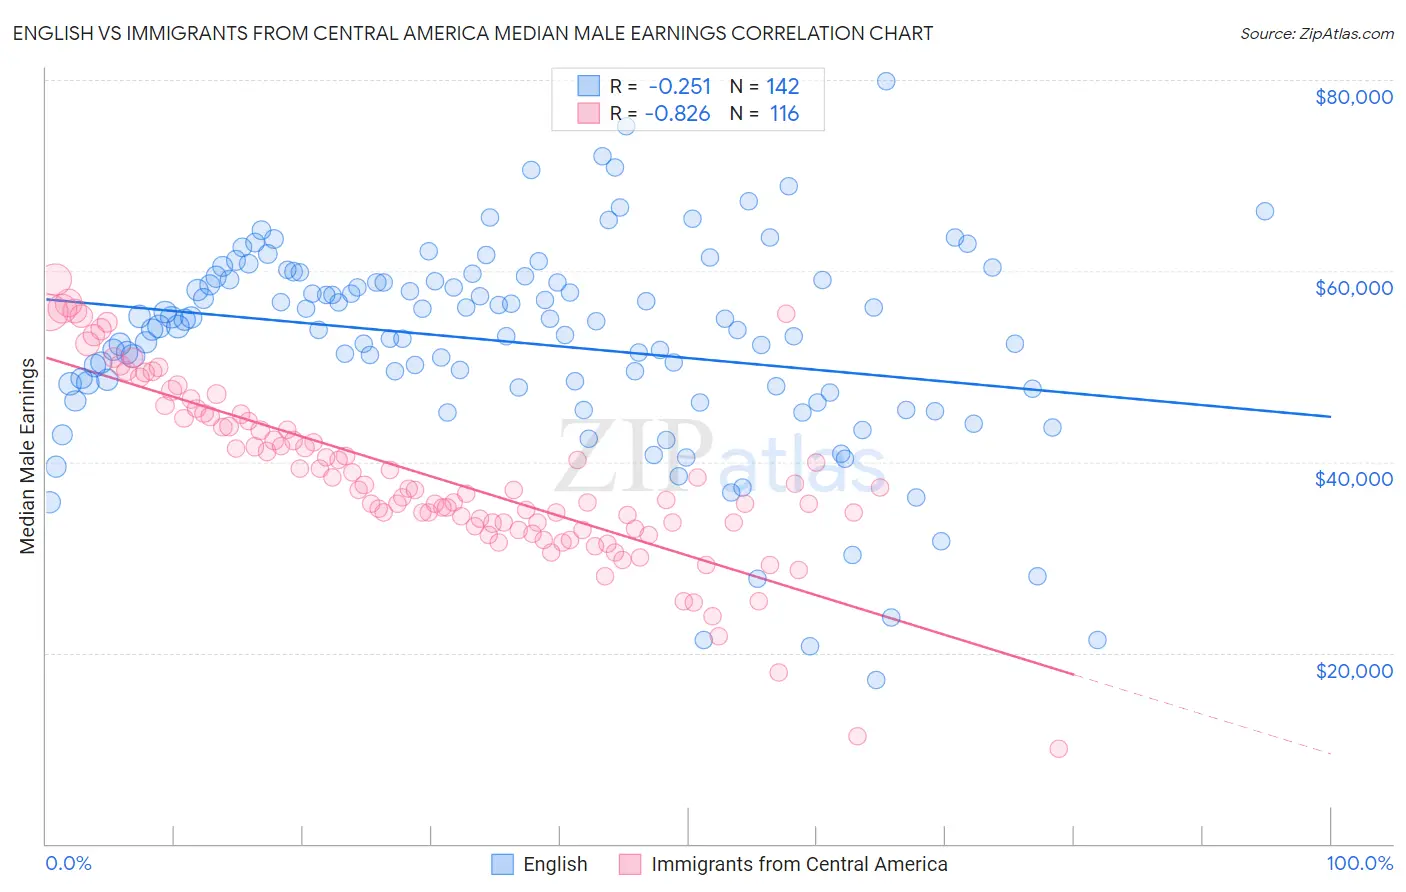
English vs Immigrants from Central America Median Male Earnings Correlation Chart
The statistical analysis conducted on geographies consisting of 577,846,764 people shows a weak negative correlation between the proportion of English and median male earnings in the United States with a correlation coefficient (R) of -0.251 and weighted average of $55,747. Similarly, the statistical analysis conducted on geographies consisting of 535,785,073 people shows a very strong negative correlation between the proportion of Immigrants from Central America and median male earnings in the United States with a correlation coefficient (R) of -0.826 and weighted average of $45,538, a difference of 22.4%.
Median Male Earnings Correlation Summary
| Measurement | English | Immigrants from Central America |
| Minimum | $17,188 | $9,917 |
| Maximum | $79,824 | $59,113 |
| Range | $62,636 | $49,196 |
| Mean | $52,541 | $38,565 |
| Median | $54,211 | $37,031 |
| Interquartile 25% (IQ1) | $47,796 | $33,411 |
| Interquartile 75% (IQ3) | $58,992 | $44,421 |
| Interquartile Range (IQR) | $11,196 | $11,009 |
| Standard Deviation (Sample) | $10,836 | $9,104 |
| Standard Deviation (Population) | $10,798 | $9,065 |
Similar Demographics by Median Male Earnings
Demographics Similar to English by Median Male Earnings
In terms of median male earnings, the demographic groups most similar to English are Swiss ($55,731, a difference of 0.030%), Immigrants from Oceania ($55,712, a difference of 0.060%), Scottish ($55,793, a difference of 0.080%), Immigrants from Philippines ($55,809, a difference of 0.11%), and Peruvian ($55,659, a difference of 0.16%).
| Demographics | Rating | Rank | Median Male Earnings |
| Ethiopians | 84.8 /100 | #142 | Excellent $56,243 |
| Sri Lankans | 83.4 /100 | #143 | Excellent $56,136 |
| Immigrants | Uganda | 82.4 /100 | #144 | Excellent $56,064 |
| Norwegians | 80.9 /100 | #145 | Excellent $55,965 |
| Immigrants | Chile | 80.7 /100 | #146 | Excellent $55,954 |
| Immigrants | Philippines | 78.4 /100 | #147 | Good $55,809 |
| Scottish | 78.2 /100 | #148 | Good $55,793 |
| English | 77.4 /100 | #149 | Good $55,747 |
| Swiss | 77.1 /100 | #150 | Good $55,731 |
| Immigrants | Oceania | 76.8 /100 | #151 | Good $55,712 |
| Peruvians | 75.8 /100 | #152 | Good $55,659 |
| Immigrants | Nepal | 75.0 /100 | #153 | Good $55,615 |
| Taiwanese | 73.9 /100 | #154 | Good $55,556 |
| Scandinavians | 73.4 /100 | #155 | Good $55,527 |
| Immigrants | Ethiopia | 71.6 /100 | #156 | Good $55,434 |
Demographics Similar to Immigrants from Central America by Median Male Earnings
In terms of median male earnings, the demographic groups most similar to Immigrants from Central America are Black/African American ($45,523, a difference of 0.030%), Sioux ($45,566, a difference of 0.060%), Fijian ($45,607, a difference of 0.15%), Yuman ($45,446, a difference of 0.20%), and Immigrants from Honduras ($45,787, a difference of 0.55%).
| Demographics | Rating | Rank | Median Male Earnings |
| Immigrants | Caribbean | 0.0 /100 | #316 | Tragic $46,193 |
| Mexicans | 0.0 /100 | #317 | Tragic $46,147 |
| Cheyenne | 0.0 /100 | #318 | Tragic $46,062 |
| Haitians | 0.0 /100 | #319 | Tragic $45,903 |
| Immigrants | Honduras | 0.0 /100 | #320 | Tragic $45,787 |
| Fijians | 0.0 /100 | #321 | Tragic $45,607 |
| Sioux | 0.0 /100 | #322 | Tragic $45,566 |
| Immigrants | Central America | 0.0 /100 | #323 | Tragic $45,538 |
| Blacks/African Americans | 0.0 /100 | #324 | Tragic $45,523 |
| Yuman | 0.0 /100 | #325 | Tragic $45,446 |
| Immigrants | Haiti | 0.0 /100 | #326 | Tragic $45,266 |
| Immigrants | Bahamas | 0.0 /100 | #327 | Tragic $45,176 |
| Kiowa | 0.0 /100 | #328 | Tragic $45,094 |
| Yakama | 0.0 /100 | #329 | Tragic $45,002 |
| Immigrants | Mexico | 0.0 /100 | #330 | Tragic $44,960 |