English vs Immigrants from Guyana Median Male Earnings
COMPARE
English
Immigrants from Guyana
Median Male Earnings
Median Male Earnings Comparison
English
Immigrants from Guyana
$55,747
MEDIAN MALE EARNINGS
77.4/ 100
METRIC RATING
149th/ 347
METRIC RANK
$50,321
MEDIAN MALE EARNINGS
1.6/ 100
METRIC RATING
248th/ 347
METRIC RANK
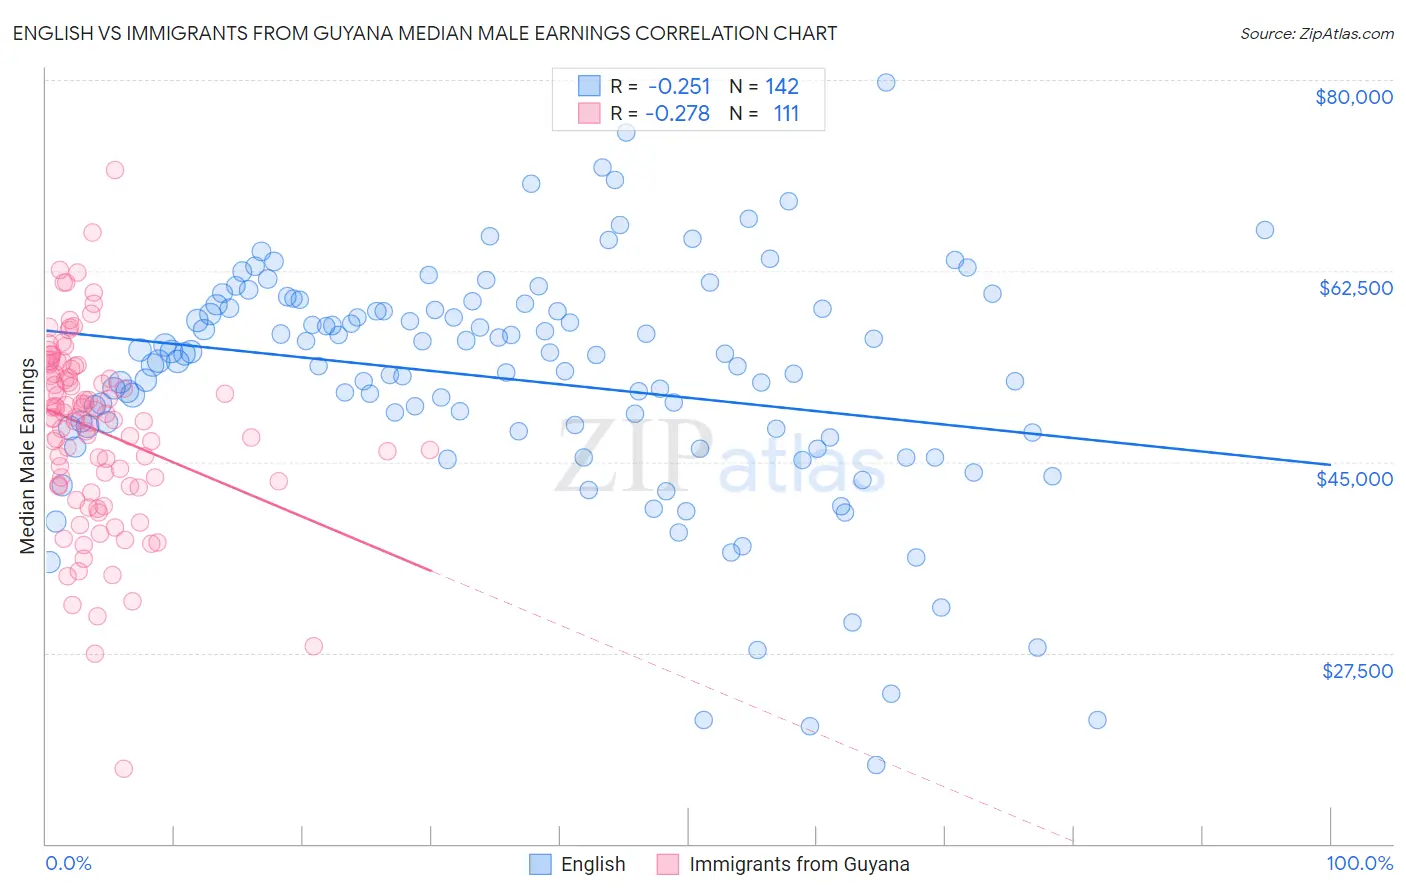
English vs Immigrants from Guyana Median Male Earnings Correlation Chart
The statistical analysis conducted on geographies consisting of 577,846,764 people shows a weak negative correlation between the proportion of English and median male earnings in the United States with a correlation coefficient (R) of -0.251 and weighted average of $55,747. Similarly, the statistical analysis conducted on geographies consisting of 183,717,574 people shows a weak negative correlation between the proportion of Immigrants from Guyana and median male earnings in the United States with a correlation coefficient (R) of -0.278 and weighted average of $50,321, a difference of 10.8%.
Median Male Earnings Correlation Summary
| Measurement | English | Immigrants from Guyana |
| Minimum | $17,188 | $16,923 |
| Maximum | $79,824 | $71,805 |
| Range | $62,636 | $54,882 |
| Mean | $52,541 | $47,916 |
| Median | $54,211 | $49,022 |
| Interquartile 25% (IQ1) | $47,796 | $42,798 |
| Interquartile 75% (IQ3) | $58,992 | $53,585 |
| Interquartile Range (IQR) | $11,196 | $10,787 |
| Standard Deviation (Sample) | $10,836 | $8,575 |
| Standard Deviation (Population) | $10,798 | $8,536 |
Similar Demographics by Median Male Earnings
Demographics Similar to English by Median Male Earnings
In terms of median male earnings, the demographic groups most similar to English are Swiss ($55,731, a difference of 0.030%), Immigrants from Oceania ($55,712, a difference of 0.060%), Scottish ($55,793, a difference of 0.080%), Immigrants from Philippines ($55,809, a difference of 0.11%), and Peruvian ($55,659, a difference of 0.16%).
| Demographics | Rating | Rank | Median Male Earnings |
| Ethiopians | 84.8 /100 | #142 | Excellent $56,243 |
| Sri Lankans | 83.4 /100 | #143 | Excellent $56,136 |
| Immigrants | Uganda | 82.4 /100 | #144 | Excellent $56,064 |
| Norwegians | 80.9 /100 | #145 | Excellent $55,965 |
| Immigrants | Chile | 80.7 /100 | #146 | Excellent $55,954 |
| Immigrants | Philippines | 78.4 /100 | #147 | Good $55,809 |
| Scottish | 78.2 /100 | #148 | Good $55,793 |
| English | 77.4 /100 | #149 | Good $55,747 |
| Swiss | 77.1 /100 | #150 | Good $55,731 |
| Immigrants | Oceania | 76.8 /100 | #151 | Good $55,712 |
| Peruvians | 75.8 /100 | #152 | Good $55,659 |
| Immigrants | Nepal | 75.0 /100 | #153 | Good $55,615 |
| Taiwanese | 73.9 /100 | #154 | Good $55,556 |
| Scandinavians | 73.4 /100 | #155 | Good $55,527 |
| Immigrants | Ethiopia | 71.6 /100 | #156 | Good $55,434 |
Demographics Similar to Immigrants from Guyana by Median Male Earnings
In terms of median male earnings, the demographic groups most similar to Immigrants from Guyana are Immigrants from Burma/Myanmar ($50,298, a difference of 0.050%), Osage ($50,292, a difference of 0.060%), Immigrants from Grenada ($50,279, a difference of 0.080%), Subsaharan African ($50,408, a difference of 0.17%), and Immigrants from Ecuador ($50,474, a difference of 0.30%).
| Demographics | Rating | Rank | Median Male Earnings |
| Immigrants | St. Vincent and the Grenadines | 2.3 /100 | #241 | Tragic $50,665 |
| Guyanese | 2.2 /100 | #242 | Tragic $50,613 |
| French American Indians | 2.2 /100 | #243 | Tragic $50,611 |
| Houma | 2.0 /100 | #244 | Tragic $50,547 |
| Hawaiians | 1.9 /100 | #245 | Tragic $50,488 |
| Immigrants | Ecuador | 1.9 /100 | #246 | Tragic $50,474 |
| Sub-Saharan Africans | 1.8 /100 | #247 | Tragic $50,408 |
| Immigrants | Guyana | 1.6 /100 | #248 | Tragic $50,321 |
| Immigrants | Burma/Myanmar | 1.6 /100 | #249 | Tragic $50,298 |
| Osage | 1.6 /100 | #250 | Tragic $50,292 |
| Immigrants | Grenada | 1.6 /100 | #251 | Tragic $50,279 |
| Immigrants | Cabo Verde | 1.2 /100 | #252 | Tragic $50,009 |
| German Russians | 1.1 /100 | #253 | Tragic $49,924 |
| Senegalese | 1.0 /100 | #254 | Tragic $49,774 |
| Alaskan Athabascans | 0.9 /100 | #255 | Tragic $49,748 |