English vs Uruguayan Median Male Earnings
COMPARE
English
Uruguayan
Median Male Earnings
Median Male Earnings Comparison
English
Uruguayans
$55,747
MEDIAN MALE EARNINGS
77.4/ 100
METRIC RATING
149th/ 347
METRIC RANK
$53,680
MEDIAN MALE EARNINGS
31.1/ 100
METRIC RATING
190th/ 347
METRIC RANK
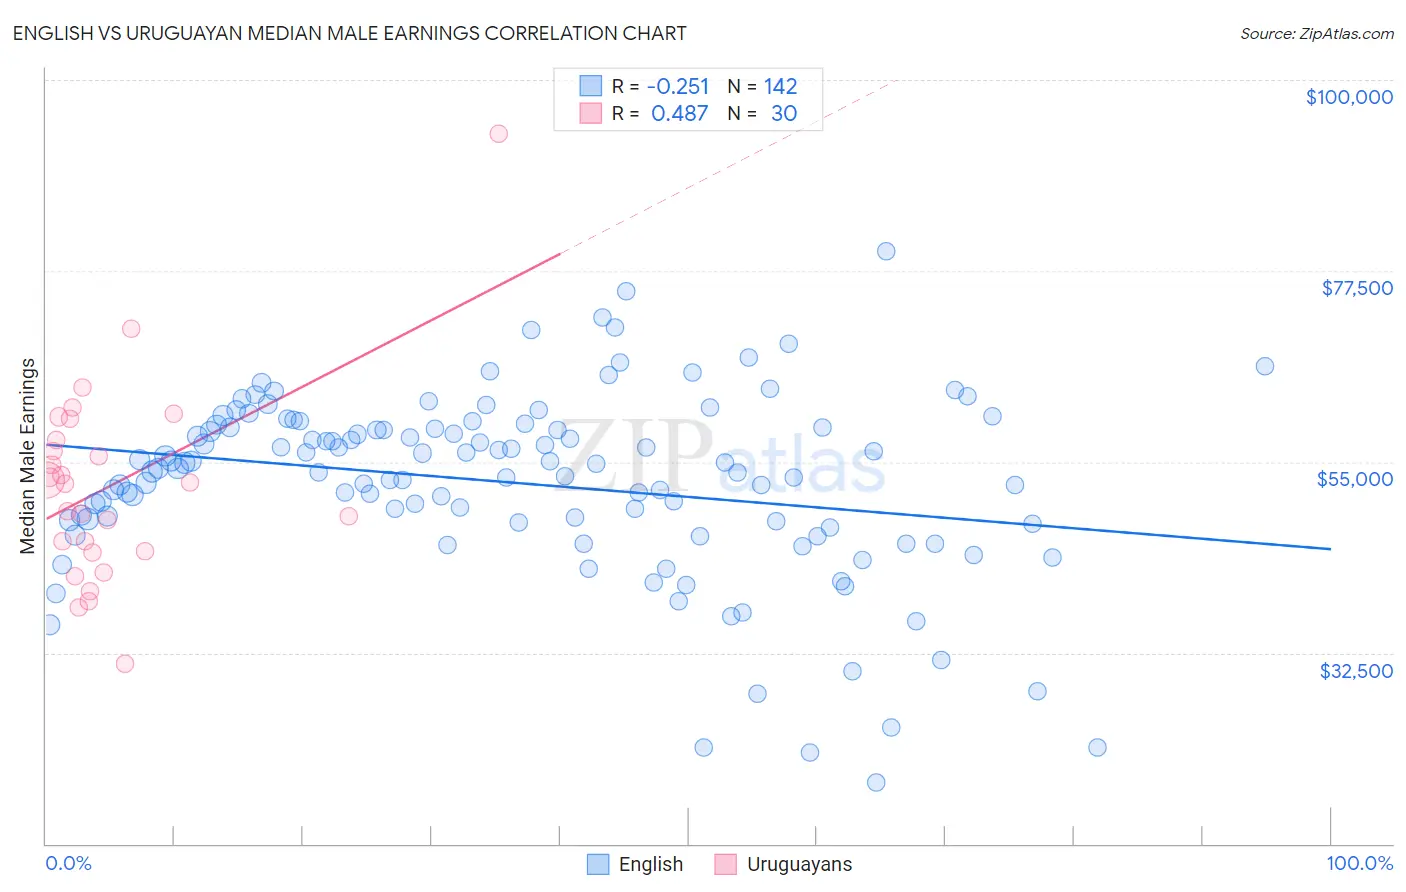
English vs Uruguayan Median Male Earnings Correlation Chart
The statistical analysis conducted on geographies consisting of 577,846,764 people shows a weak negative correlation between the proportion of English and median male earnings in the United States with a correlation coefficient (R) of -0.251 and weighted average of $55,747. Similarly, the statistical analysis conducted on geographies consisting of 144,776,277 people shows a moderate positive correlation between the proportion of Uruguayans and median male earnings in the United States with a correlation coefficient (R) of 0.487 and weighted average of $53,680, a difference of 3.8%.
Median Male Earnings Correlation Summary
| Measurement | English | Uruguayan |
| Minimum | $17,188 | $31,250 |
| Maximum | $79,824 | $93,710 |
| Range | $62,636 | $62,460 |
| Mean | $52,541 | $52,178 |
| Median | $54,211 | $52,491 |
| Interquartile 25% (IQ1) | $47,796 | $44,514 |
| Interquartile 75% (IQ3) | $58,992 | $57,550 |
| Interquartile Range (IQR) | $11,196 | $13,036 |
| Standard Deviation (Sample) | $10,836 | $11,765 |
| Standard Deviation (Population) | $10,798 | $11,568 |
Similar Demographics by Median Male Earnings
Demographics Similar to English by Median Male Earnings
In terms of median male earnings, the demographic groups most similar to English are Swiss ($55,731, a difference of 0.030%), Immigrants from Oceania ($55,712, a difference of 0.060%), Scottish ($55,793, a difference of 0.080%), Immigrants from Philippines ($55,809, a difference of 0.11%), and Peruvian ($55,659, a difference of 0.16%).
| Demographics | Rating | Rank | Median Male Earnings |
| Ethiopians | 84.8 /100 | #142 | Excellent $56,243 |
| Sri Lankans | 83.4 /100 | #143 | Excellent $56,136 |
| Immigrants | Uganda | 82.4 /100 | #144 | Excellent $56,064 |
| Norwegians | 80.9 /100 | #145 | Excellent $55,965 |
| Immigrants | Chile | 80.7 /100 | #146 | Excellent $55,954 |
| Immigrants | Philippines | 78.4 /100 | #147 | Good $55,809 |
| Scottish | 78.2 /100 | #148 | Good $55,793 |
| English | 77.4 /100 | #149 | Good $55,747 |
| Swiss | 77.1 /100 | #150 | Good $55,731 |
| Immigrants | Oceania | 76.8 /100 | #151 | Good $55,712 |
| Peruvians | 75.8 /100 | #152 | Good $55,659 |
| Immigrants | Nepal | 75.0 /100 | #153 | Good $55,615 |
| Taiwanese | 73.9 /100 | #154 | Good $55,556 |
| Scandinavians | 73.4 /100 | #155 | Good $55,527 |
| Immigrants | Ethiopia | 71.6 /100 | #156 | Good $55,434 |
Demographics Similar to Uruguayans by Median Male Earnings
In terms of median male earnings, the demographic groups most similar to Uruguayans are Puget Sound Salish ($53,704, a difference of 0.040%), Guamanian/Chamorro ($53,661, a difference of 0.040%), Scotch-Irish ($53,658, a difference of 0.040%), Immigrants from Eritrea ($53,715, a difference of 0.060%), and Immigrants from Eastern Africa ($53,713, a difference of 0.060%).
| Demographics | Rating | Rank | Median Male Earnings |
| Immigrants | South America | 37.3 /100 | #183 | Fair $53,962 |
| Whites/Caucasians | 36.5 /100 | #184 | Fair $53,925 |
| Immigrants | Sierra Leone | 36.0 /100 | #185 | Fair $53,905 |
| Colombians | 34.4 /100 | #186 | Fair $53,832 |
| Immigrants | Eritrea | 31.8 /100 | #187 | Fair $53,715 |
| Immigrants | Eastern Africa | 31.8 /100 | #188 | Fair $53,713 |
| Puget Sound Salish | 31.6 /100 | #189 | Fair $53,704 |
| Uruguayans | 31.1 /100 | #190 | Fair $53,680 |
| Guamanians/Chamorros | 30.7 /100 | #191 | Fair $53,661 |
| Scotch-Irish | 30.6 /100 | #192 | Fair $53,658 |
| Kenyans | 30.4 /100 | #193 | Fair $53,647 |
| Spanish | 29.0 /100 | #194 | Fair $53,576 |
| Immigrants | Azores | 27.5 /100 | #195 | Fair $53,503 |
| Immigrants | Africa | 26.6 /100 | #196 | Fair $53,457 |
| Immigrants | Kenya | 26.0 /100 | #197 | Fair $53,427 |