English vs Sri Lankan Median Male Earnings
COMPARE
English
Sri Lankan
Median Male Earnings
Median Male Earnings Comparison
English
Sri Lankans
$55,747
MEDIAN MALE EARNINGS
77.4/ 100
METRIC RATING
149th/ 347
METRIC RANK
$56,136
MEDIAN MALE EARNINGS
83.4/ 100
METRIC RATING
143rd/ 347
METRIC RANK
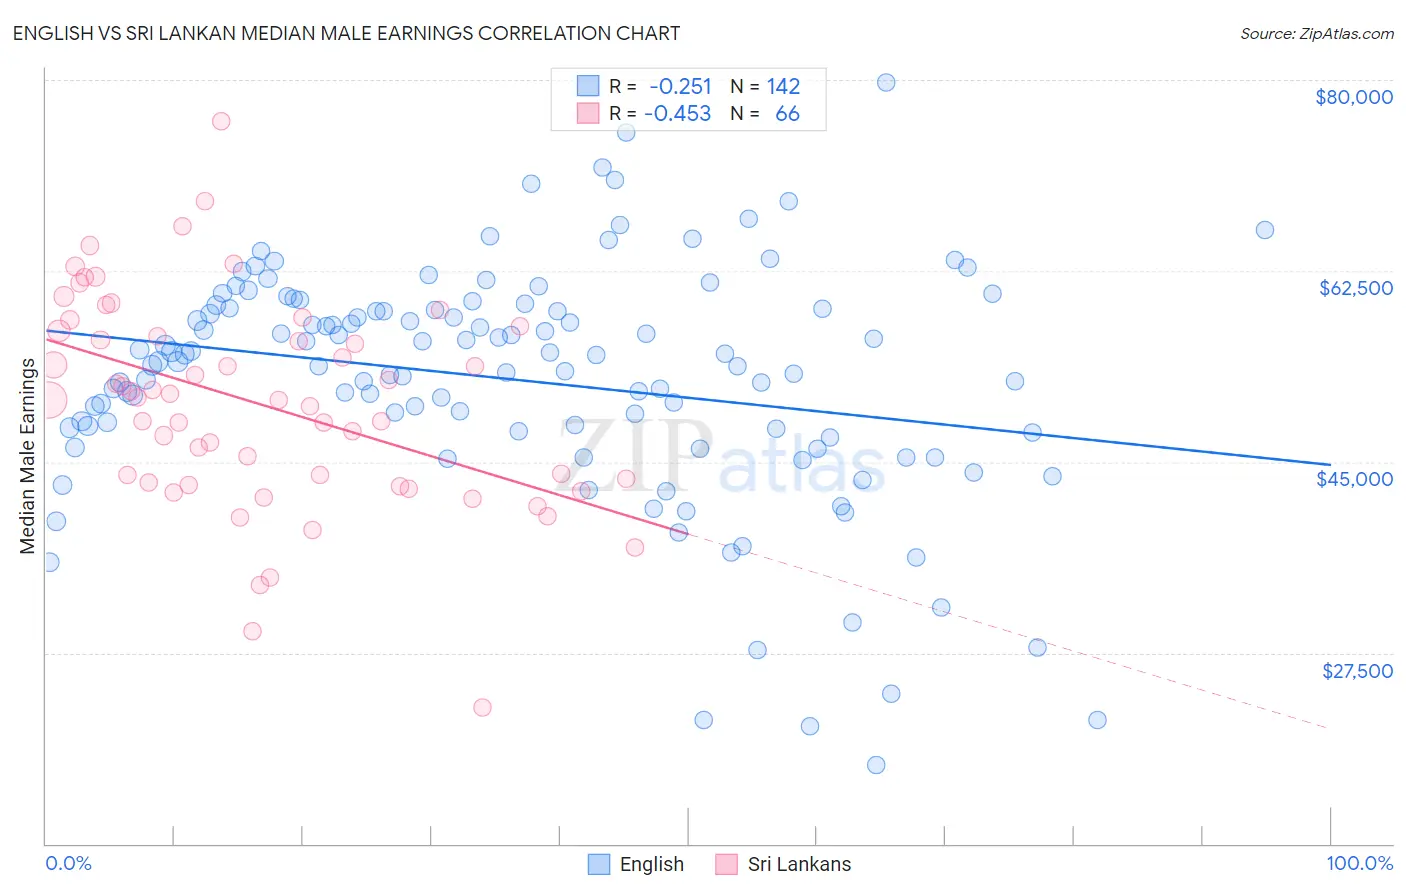
English vs Sri Lankan Median Male Earnings Correlation Chart
The statistical analysis conducted on geographies consisting of 577,846,764 people shows a weak negative correlation between the proportion of English and median male earnings in the United States with a correlation coefficient (R) of -0.251 and weighted average of $55,747. Similarly, the statistical analysis conducted on geographies consisting of 440,493,989 people shows a moderate negative correlation between the proportion of Sri Lankans and median male earnings in the United States with a correlation coefficient (R) of -0.453 and weighted average of $56,136, a difference of 0.70%.
Median Male Earnings Correlation Summary
| Measurement | English | Sri Lankan |
| Minimum | $17,188 | $22,532 |
| Maximum | $79,824 | $76,188 |
| Range | $62,636 | $53,656 |
| Mean | $52,541 | $50,350 |
| Median | $54,211 | $50,806 |
| Interquartile 25% (IQ1) | $47,796 | $43,067 |
| Interquartile 75% (IQ3) | $58,992 | $57,026 |
| Interquartile Range (IQR) | $11,196 | $13,959 |
| Standard Deviation (Sample) | $10,836 | $9,663 |
| Standard Deviation (Population) | $10,798 | $9,589 |
Demographics Similar to English and Sri Lankans by Median Male Earnings
In terms of median male earnings, the demographic groups most similar to English are Swiss ($55,731, a difference of 0.030%), Immigrants from Oceania ($55,712, a difference of 0.060%), Scottish ($55,793, a difference of 0.080%), Immigrants from Philippines ($55,809, a difference of 0.11%), and Peruvian ($55,659, a difference of 0.16%). Similarly, the demographic groups most similar to Sri Lankans are Immigrants from Uganda ($56,064, a difference of 0.13%), Danish ($56,246, a difference of 0.19%), Ethiopian ($56,243, a difference of 0.19%), Zimbabwean ($56,302, a difference of 0.29%), and Luxembourger ($56,300, a difference of 0.29%).
| Demographics | Rating | Rank | Median Male Earnings |
| Immigrants | Saudi Arabia | 87.2 /100 | #136 | Excellent $56,452 |
| Slavs | 86.5 /100 | #137 | Excellent $56,390 |
| Slovaks | 85.5 /100 | #138 | Excellent $56,306 |
| Zimbabweans | 85.5 /100 | #139 | Excellent $56,302 |
| Luxembourgers | 85.5 /100 | #140 | Excellent $56,300 |
| Danes | 84.8 /100 | #141 | Excellent $56,246 |
| Ethiopians | 84.8 /100 | #142 | Excellent $56,243 |
| Sri Lankans | 83.4 /100 | #143 | Excellent $56,136 |
| Immigrants | Uganda | 82.4 /100 | #144 | Excellent $56,064 |
| Norwegians | 80.9 /100 | #145 | Excellent $55,965 |
| Immigrants | Chile | 80.7 /100 | #146 | Excellent $55,954 |
| Immigrants | Philippines | 78.4 /100 | #147 | Good $55,809 |
| Scottish | 78.2 /100 | #148 | Good $55,793 |
| English | 77.4 /100 | #149 | Good $55,747 |
| Swiss | 77.1 /100 | #150 | Good $55,731 |
| Immigrants | Oceania | 76.8 /100 | #151 | Good $55,712 |
| Peruvians | 75.8 /100 | #152 | Good $55,659 |
| Immigrants | Nepal | 75.0 /100 | #153 | Good $55,615 |
| Taiwanese | 73.9 /100 | #154 | Good $55,556 |
| Scandinavians | 73.4 /100 | #155 | Good $55,527 |
| Immigrants | Ethiopia | 71.6 /100 | #156 | Good $55,434 |