Immigrants from Cabo Verde vs Immigrants from Jordan Wage/Income Gap
COMPARE
Immigrants from Cabo Verde
Immigrants from Jordan
Wage/Income Gap
Wage/Income Gap Comparison
Immigrants from Cabo Verde
Immigrants from Jordan
23.6%
WAGE/INCOME GAP
99.5/ 100
METRIC RATING
93rd/ 347
METRIC RANK
26.3%
WAGE/INCOME GAP
22.4/ 100
METRIC RATING
193rd/ 347
METRIC RANK
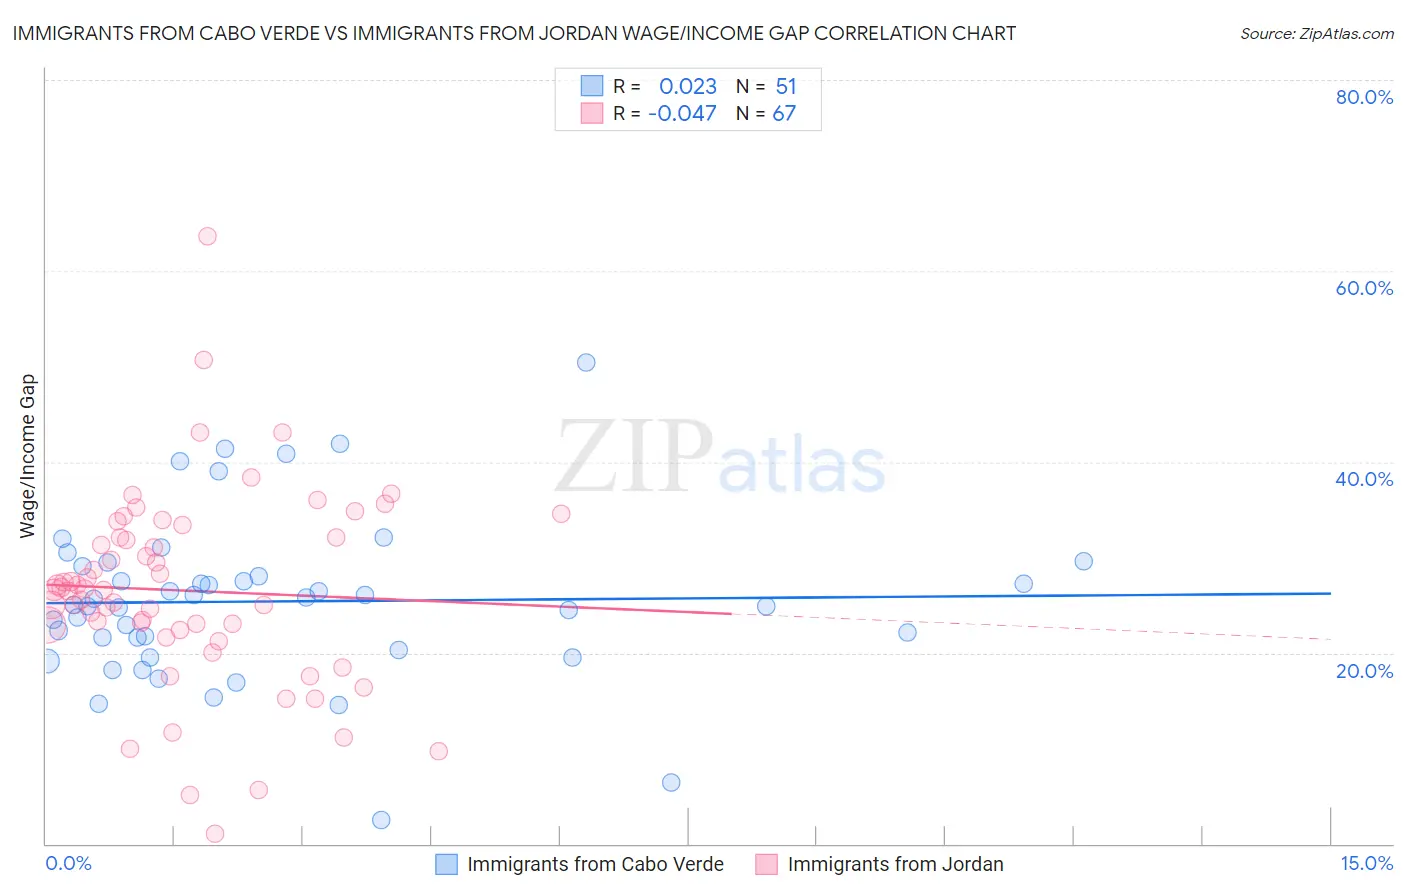
Immigrants from Cabo Verde vs Immigrants from Jordan Wage/Income Gap Correlation Chart
The statistical analysis conducted on geographies consisting of 38,157,799 people shows no correlation between the proportion of Immigrants from Cabo Verde and wage/income gap percentage in the United States with a correlation coefficient (R) of 0.023 and weighted average of 23.6%. Similarly, the statistical analysis conducted on geographies consisting of 181,259,596 people shows no correlation between the proportion of Immigrants from Jordan and wage/income gap percentage in the United States with a correlation coefficient (R) of -0.047 and weighted average of 26.3%, a difference of 11.6%.
Wage/Income Gap Correlation Summary
| Measurement | Immigrants from Cabo Verde | Immigrants from Jordan |
| Minimum | 2.5% | 1.1% |
| Maximum | 50.5% | 63.6% |
| Range | 48.0% | 62.5% |
| Mean | 25.4% | 26.5% |
| Median | 25.0% | 26.6% |
| Interquartile 25% (IQ1) | 20.3% | 22.3% |
| Interquartile 75% (IQ3) | 29.1% | 32.1% |
| Interquartile Range (IQR) | 8.8% | 9.7% |
| Standard Deviation (Sample) | 8.6% | 10.3% |
| Standard Deviation (Population) | 8.5% | 10.2% |
Similar Demographics by Wage/Income Gap
Demographics Similar to Immigrants from Cabo Verde by Wage/Income Gap
In terms of wage/income gap, the demographic groups most similar to Immigrants from Cabo Verde are Honduran (23.6%, a difference of 0.090%), Cape Verdean (23.6%, a difference of 0.12%), Immigrants from Honduras (23.5%, a difference of 0.24%), Kiowa (23.6%, a difference of 0.24%), and Immigrants from Sudan (23.6%, a difference of 0.33%).
| Demographics | Rating | Rank | Wage/Income Gap |
| Cheyenne | 99.7 /100 | #86 | Exceptional 23.3% |
| Yuman | 99.7 /100 | #87 | Exceptional 23.3% |
| Immigrants | Panama | 99.6 /100 | #88 | Exceptional 23.4% |
| Marshallese | 99.6 /100 | #89 | Exceptional 23.4% |
| Nicaraguans | 99.6 /100 | #90 | Exceptional 23.4% |
| Arapaho | 99.6 /100 | #91 | Exceptional 23.5% |
| Immigrants | Honduras | 99.5 /100 | #92 | Exceptional 23.5% |
| Immigrants | Cabo Verde | 99.5 /100 | #93 | Exceptional 23.6% |
| Hondurans | 99.5 /100 | #94 | Exceptional 23.6% |
| Cape Verdeans | 99.4 /100 | #95 | Exceptional 23.6% |
| Kiowa | 99.4 /100 | #96 | Exceptional 23.6% |
| Immigrants | Sudan | 99.4 /100 | #97 | Exceptional 23.6% |
| Immigrants | Latin America | 99.2 /100 | #98 | Exceptional 23.7% |
| Aleuts | 99.2 /100 | #99 | Exceptional 23.7% |
| Yakama | 99.2 /100 | #100 | Exceptional 23.7% |
Demographics Similar to Immigrants from Jordan by Wage/Income Gap
In terms of wage/income gap, the demographic groups most similar to Immigrants from Jordan are Chilean (26.3%, a difference of 0.0%), Immigrants from Bulgaria (26.3%, a difference of 0.020%), Immigrants from Malaysia (26.3%, a difference of 0.020%), Immigrants from Western Asia (26.3%, a difference of 0.060%), and Zimbabwean (26.3%, a difference of 0.070%).
| Demographics | Rating | Rank | Wage/Income Gap |
| Immigrants | Indonesia | 32.5 /100 | #186 | Fair 26.1% |
| Palestinians | 29.9 /100 | #187 | Fair 26.1% |
| Immigrants | Egypt | 29.9 /100 | #188 | Fair 26.1% |
| Immigrants | Moldova | 26.6 /100 | #189 | Fair 26.2% |
| Immigrants | Croatia | 24.8 /100 | #190 | Fair 26.2% |
| Immigrants | Venezuela | 24.7 /100 | #191 | Fair 26.2% |
| Immigrants | Bulgaria | 22.5 /100 | #192 | Fair 26.3% |
| Immigrants | Jordan | 22.4 /100 | #193 | Fair 26.3% |
| Chileans | 22.3 /100 | #194 | Fair 26.3% |
| Immigrants | Malaysia | 22.2 /100 | #195 | Fair 26.3% |
| Immigrants | Western Asia | 21.7 /100 | #196 | Fair 26.3% |
| Zimbabweans | 21.6 /100 | #197 | Fair 26.3% |
| Venezuelans | 21.5 /100 | #198 | Fair 26.3% |
| Dutch West Indians | 21.0 /100 | #199 | Fair 26.3% |
| Delaware | 20.9 /100 | #200 | Fair 26.3% |