Croatian vs Lithuanian Per Capita Income
COMPARE
Croatian
Lithuanian
Per Capita Income
Per Capita Income Comparison
Croatians
Lithuanians
$47,742
PER CAPITA INCOME
99.0/ 100
METRIC RATING
88th/ 347
METRIC RANK
$49,448
PER CAPITA INCOME
99.8/ 100
METRIC RATING
68th/ 347
METRIC RANK
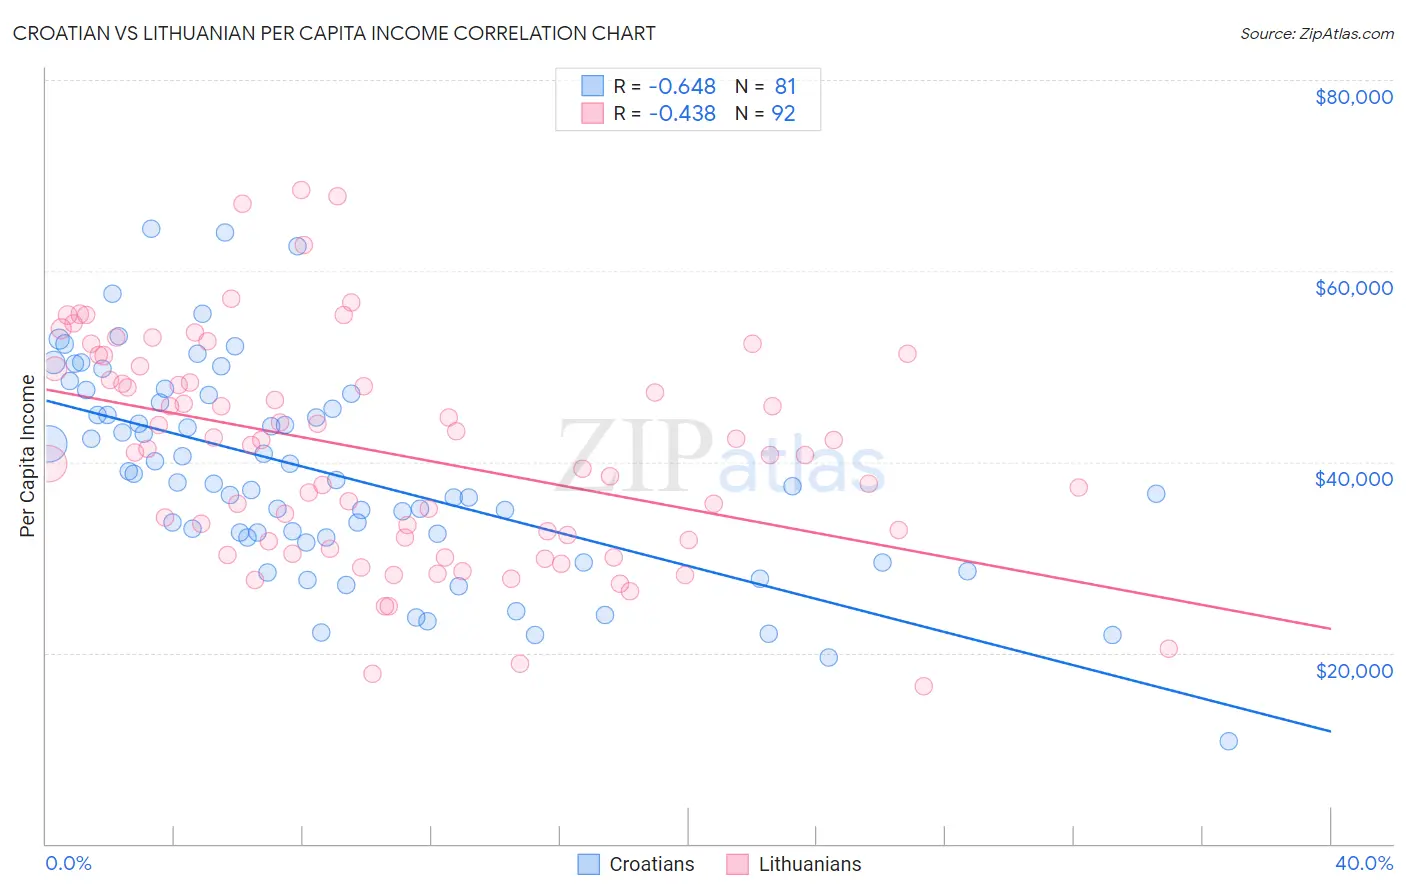
Croatian vs Lithuanian Per Capita Income Correlation Chart
The statistical analysis conducted on geographies consisting of 375,755,176 people shows a significant negative correlation between the proportion of Croatians and per capita income in the United States with a correlation coefficient (R) of -0.648 and weighted average of $47,742. Similarly, the statistical analysis conducted on geographies consisting of 421,963,914 people shows a moderate negative correlation between the proportion of Lithuanians and per capita income in the United States with a correlation coefficient (R) of -0.438 and weighted average of $49,448, a difference of 3.6%.
Per Capita Income Correlation Summary
| Measurement | Croatian | Lithuanian |
| Minimum | $10,765 | $16,487 |
| Maximum | $64,427 | $68,542 |
| Range | $53,662 | $52,055 |
| Mean | $38,757 | $40,931 |
| Median | $37,830 | $41,220 |
| Interquartile 25% (IQ1) | $32,092 | $31,717 |
| Interquartile 75% (IQ3) | $46,598 | $49,156 |
| Interquartile Range (IQR) | $14,505 | $17,439 |
| Standard Deviation (Sample) | $10,847 | $11,469 |
| Standard Deviation (Population) | $10,780 | $11,406 |
Demographics Similar to Croatians and Lithuanians by Per Capita Income
In terms of per capita income, the demographic groups most similar to Croatians are Ukrainian ($48,014, a difference of 0.57%), Immigrants from Southern Europe ($48,027, a difference of 0.60%), Austrian ($48,116, a difference of 0.78%), Immigrants from Ukraine ($48,134, a difference of 0.82%), and Immigrants from Brazil ($48,164, a difference of 0.88%). Similarly, the demographic groups most similar to Lithuanians are Immigrants from Canada ($49,412, a difference of 0.070%), Immigrants from Eastern Europe ($49,316, a difference of 0.27%), Greek ($49,309, a difference of 0.28%), Immigrants from Hungary ($49,303, a difference of 0.29%), and Immigrants from North America ($49,302, a difference of 0.30%).
| Demographics | Rating | Rank | Per Capita Income |
| Lithuanians | 99.8 /100 | #68 | Exceptional $49,448 |
| Immigrants | Canada | 99.8 /100 | #69 | Exceptional $49,412 |
| Immigrants | Eastern Europe | 99.8 /100 | #70 | Exceptional $49,316 |
| Greeks | 99.8 /100 | #71 | Exceptional $49,309 |
| Immigrants | Hungary | 99.8 /100 | #72 | Exceptional $49,303 |
| Immigrants | North America | 99.8 /100 | #73 | Exceptional $49,302 |
| Mongolians | 99.8 /100 | #74 | Exceptional $49,173 |
| Immigrants | Bolivia | 99.7 /100 | #75 | Exceptional $48,970 |
| Immigrants | England | 99.7 /100 | #76 | Exceptional $48,844 |
| Immigrants | Kazakhstan | 99.7 /100 | #77 | Exceptional $48,747 |
| Immigrants | Italy | 99.6 /100 | #78 | Exceptional $48,654 |
| Romanians | 99.5 /100 | #79 | Exceptional $48,445 |
| Egyptians | 99.5 /100 | #80 | Exceptional $48,358 |
| Armenians | 99.4 /100 | #81 | Exceptional $48,287 |
| Immigrants | Indonesia | 99.4 /100 | #82 | Exceptional $48,195 |
| Immigrants | Brazil | 99.4 /100 | #83 | Exceptional $48,164 |
| Immigrants | Ukraine | 99.3 /100 | #84 | Exceptional $48,134 |
| Austrians | 99.3 /100 | #85 | Exceptional $48,116 |
| Immigrants | Southern Europe | 99.3 /100 | #86 | Exceptional $48,027 |
| Ukrainians | 99.3 /100 | #87 | Exceptional $48,014 |
| Croatians | 99.0 /100 | #88 | Exceptional $47,742 |