Danish vs Lithuanian Divorced or Separated
COMPARE
Danish
Lithuanian
Divorced or Separated
Divorced or Separated Comparison
Danes
Lithuanians
11.9%
DIVORCED OR SEPARATED
84.8/ 100
METRIC RATING
135th/ 347
METRIC RANK
11.7%
DIVORCED OR SEPARATED
95.7/ 100
METRIC RATING
115th/ 347
METRIC RANK
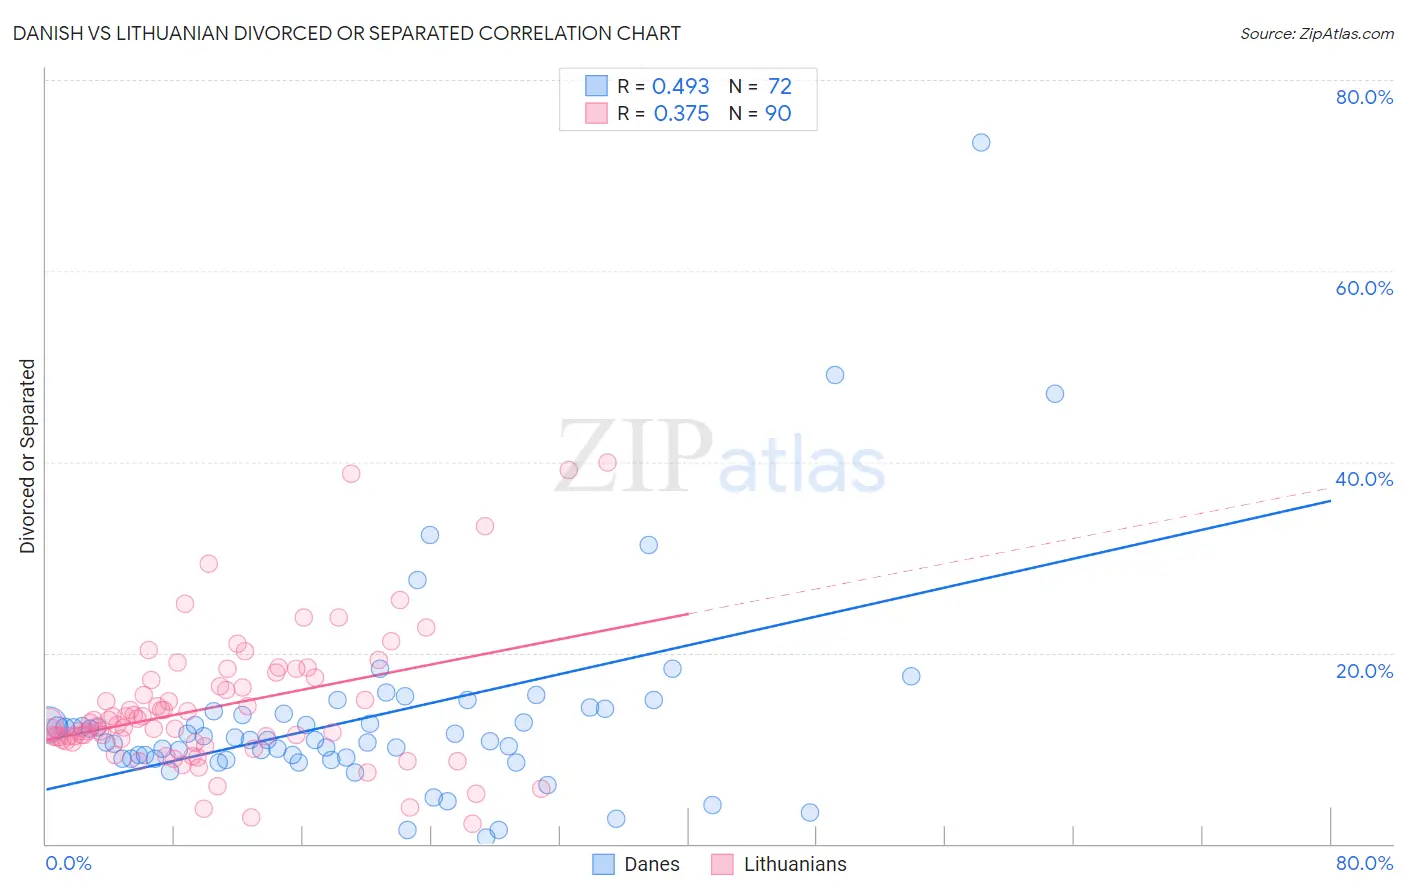
Danish vs Lithuanian Divorced or Separated Correlation Chart
The statistical analysis conducted on geographies consisting of 473,966,187 people shows a moderate positive correlation between the proportion of Danes and percentage of population currently divorced or separated in the United States with a correlation coefficient (R) of 0.493 and weighted average of 11.9%. Similarly, the statistical analysis conducted on geographies consisting of 421,781,235 people shows a mild positive correlation between the proportion of Lithuanians and percentage of population currently divorced or separated in the United States with a correlation coefficient (R) of 0.375 and weighted average of 11.7%, a difference of 1.2%.
Divorced or Separated Correlation Summary
| Measurement | Danish | Lithuanian |
| Minimum | 0.70% | 2.1% |
| Maximum | 73.4% | 40.0% |
| Range | 72.7% | 37.9% |
| Mean | 13.2% | 14.4% |
| Median | 10.9% | 12.5% |
| Interquartile 25% (IQ1) | 8.9% | 10.8% |
| Interquartile 75% (IQ3) | 13.8% | 17.1% |
| Interquartile Range (IQR) | 4.8% | 6.3% |
| Standard Deviation (Sample) | 10.9% | 7.2% |
| Standard Deviation (Population) | 10.8% | 7.2% |
Demographics Similar to Danes and Lithuanians by Divorced or Separated
In terms of divorced or separated, the demographic groups most similar to Danes are Argentinean (11.9%, a difference of 0.020%), New Zealander (11.9%, a difference of 0.20%), Immigrants from Afghanistan (11.8%, a difference of 0.23%), Immigrants from Austria (11.8%, a difference of 0.26%), and Immigrants from Cambodia (11.8%, a difference of 0.26%). Similarly, the demographic groups most similar to Lithuanians are Immigrants from Iraq (11.7%, a difference of 0.060%), Immigrants from Uganda (11.7%, a difference of 0.080%), Ecuadorian (11.7%, a difference of 0.090%), Syrian (11.7%, a difference of 0.13%), and Iraqi (11.8%, a difference of 0.22%).
| Demographics | Rating | Rank | Divorced or Separated |
| Lithuanians | 95.7 /100 | #115 | Exceptional 11.7% |
| Immigrants | Iraq | 95.4 /100 | #116 | Exceptional 11.7% |
| Immigrants | Uganda | 95.3 /100 | #117 | Exceptional 11.7% |
| Ecuadorians | 95.3 /100 | #118 | Exceptional 11.7% |
| Syrians | 95.1 /100 | #119 | Exceptional 11.7% |
| Iraqis | 94.6 /100 | #120 | Exceptional 11.8% |
| Romanians | 94.5 /100 | #121 | Exceptional 11.8% |
| Menominee | 93.8 /100 | #122 | Exceptional 11.8% |
| Immigrants | Immigrants | 93.7 /100 | #123 | Exceptional 11.8% |
| Ugandans | 93.1 /100 | #124 | Exceptional 11.8% |
| Ukrainians | 92.3 /100 | #125 | Exceptional 11.8% |
| South American Indians | 92.1 /100 | #126 | Exceptional 11.8% |
| South Africans | 88.9 /100 | #127 | Excellent 11.8% |
| Immigrants | Ecuador | 88.9 /100 | #128 | Excellent 11.8% |
| Immigrants | St. Vincent and the Grenadines | 88.4 /100 | #129 | Excellent 11.8% |
| Immigrants | Austria | 88.2 /100 | #130 | Excellent 11.8% |
| Immigrants | Cambodia | 88.2 /100 | #131 | Excellent 11.8% |
| Immigrants | Afghanistan | 87.9 /100 | #132 | Excellent 11.8% |
| New Zealanders | 87.5 /100 | #133 | Excellent 11.9% |
| Argentineans | 85.1 /100 | #134 | Excellent 11.9% |
| Danes | 84.8 /100 | #135 | Excellent 11.9% |