Filipino vs Immigrants from Croatia Per Capita Income
COMPARE
Filipino
Immigrants from Croatia
Per Capita Income
Per Capita Income Comparison
Filipinos
Immigrants from Croatia
$59,066
PER CAPITA INCOME
100.0/ 100
METRIC RATING
1st/ 347
METRIC RANK
$50,417
PER CAPITA INCOME
99.9/ 100
METRIC RATING
52nd/ 347
METRIC RANK
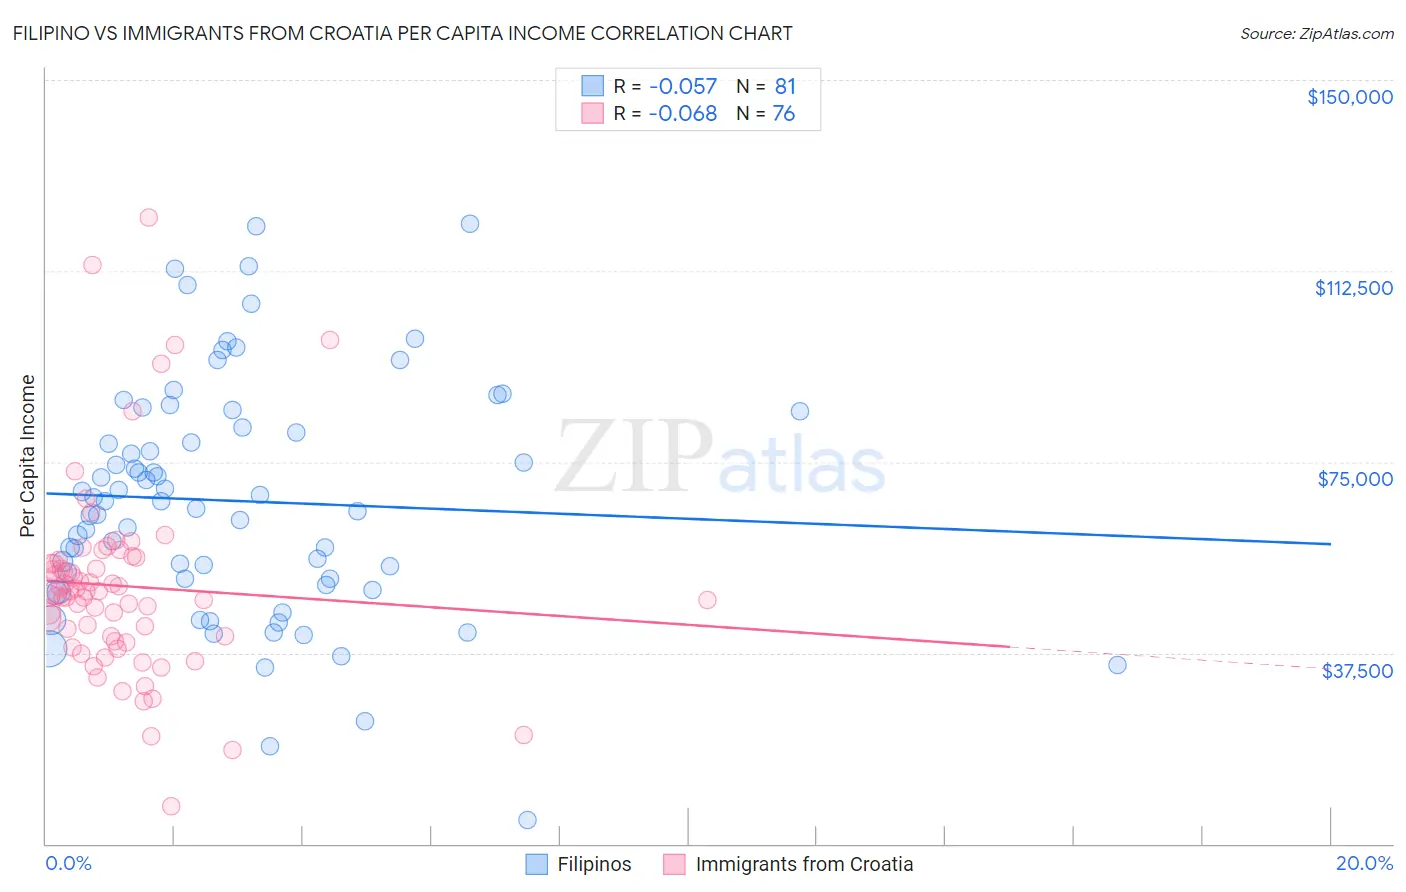
Filipino vs Immigrants from Croatia Per Capita Income Correlation Chart
The statistical analysis conducted on geographies consisting of 254,359,894 people shows a slight negative correlation between the proportion of Filipinos and per capita income in the United States with a correlation coefficient (R) of -0.057 and weighted average of $59,066. Similarly, the statistical analysis conducted on geographies consisting of 132,568,979 people shows a slight negative correlation between the proportion of Immigrants from Croatia and per capita income in the United States with a correlation coefficient (R) of -0.068 and weighted average of $50,417, a difference of 17.2%.
Per Capita Income Correlation Summary
| Measurement | Filipino | Immigrants from Croatia |
| Minimum | $4,657 | $7,427 |
| Maximum | $121,798 | $123,040 |
| Range | $117,141 | $115,613 |
| Mean | $67,314 | $50,621 |
| Median | $67,249 | $49,179 |
| Interquartile 25% (IQ1) | $51,364 | $40,218 |
| Interquartile 75% (IQ3) | $83,421 | $55,379 |
| Interquartile Range (IQR) | $32,057 | $15,162 |
| Standard Deviation (Sample) | $23,294 | $19,242 |
| Standard Deviation (Population) | $23,149 | $19,115 |
Similar Demographics by Per Capita Income
Demographics Similar to Filipinos by Per Capita Income
In terms of per capita income, the demographic groups most similar to Filipinos are Iranian ($58,786, a difference of 0.48%), Immigrants from Singapore ($58,353, a difference of 1.2%), Immigrants from Australia ($57,953, a difference of 1.9%), Immigrants from Iran ($57,759, a difference of 2.3%), and Immigrants from Taiwan ($57,742, a difference of 2.3%).
| Demographics | Rating | Rank | Per Capita Income |
| Filipinos | 100.0 /100 | #1 | Exceptional $59,066 |
| Iranians | 100.0 /100 | #2 | Exceptional $58,786 |
| Immigrants | Singapore | 100.0 /100 | #3 | Exceptional $58,353 |
| Immigrants | Australia | 100.0 /100 | #4 | Exceptional $57,953 |
| Immigrants | Iran | 100.0 /100 | #5 | Exceptional $57,759 |
| Immigrants | Taiwan | 100.0 /100 | #6 | Exceptional $57,742 |
| Immigrants | Israel | 100.0 /100 | #7 | Exceptional $57,384 |
| Immigrants | Hong Kong | 100.0 /100 | #8 | Exceptional $56,709 |
| Immigrants | Ireland | 100.0 /100 | #9 | Exceptional $56,584 |
| Okinawans | 100.0 /100 | #10 | Exceptional $55,817 |
| Eastern Europeans | 100.0 /100 | #11 | Exceptional $55,780 |
| Immigrants | Sweden | 100.0 /100 | #12 | Exceptional $55,582 |
| Immigrants | India | 100.0 /100 | #13 | Exceptional $55,268 |
| Immigrants | Belgium | 100.0 /100 | #14 | Exceptional $55,082 |
| Cypriots | 100.0 /100 | #15 | Exceptional $54,899 |
Demographics Similar to Immigrants from Croatia by Per Capita Income
In terms of per capita income, the demographic groups most similar to Immigrants from Croatia are Paraguayan ($50,385, a difference of 0.060%), Immigrants from Netherlands ($50,458, a difference of 0.080%), Immigrants from Belarus ($50,303, a difference of 0.23%), Immigrants from Sri Lanka ($50,555, a difference of 0.27%), and New Zealander ($50,575, a difference of 0.31%).
| Demographics | Rating | Rank | Per Capita Income |
| Immigrants | Spain | 100.0 /100 | #45 | Exceptional $50,933 |
| Immigrants | Latvia | 100.0 /100 | #46 | Exceptional $50,914 |
| Bulgarians | 100.0 /100 | #47 | Exceptional $50,906 |
| Immigrants | Serbia | 100.0 /100 | #48 | Exceptional $50,810 |
| New Zealanders | 100.0 /100 | #49 | Exceptional $50,575 |
| Immigrants | Sri Lanka | 100.0 /100 | #50 | Exceptional $50,555 |
| Immigrants | Netherlands | 100.0 /100 | #51 | Exceptional $50,458 |
| Immigrants | Croatia | 99.9 /100 | #52 | Exceptional $50,417 |
| Paraguayans | 99.9 /100 | #53 | Exceptional $50,385 |
| Immigrants | Belarus | 99.9 /100 | #54 | Exceptional $50,303 |
| Immigrants | Western Europe | 99.9 /100 | #55 | Exceptional $50,065 |
| Asians | 99.9 /100 | #56 | Exceptional $50,057 |
| South Africans | 99.9 /100 | #57 | Exceptional $50,044 |
| Immigrants | Malaysia | 99.9 /100 | #58 | Exceptional $49,983 |
| Bhutanese | 99.9 /100 | #59 | Exceptional $49,894 |