Basque vs Immigrants from Croatia Per Capita Income
COMPARE
Basque
Immigrants from Croatia
Per Capita Income
Per Capita Income Comparison
Basques
Immigrants from Croatia
$45,086
PER CAPITA INCOME
83.2/ 100
METRIC RATING
139th/ 347
METRIC RANK
$50,417
PER CAPITA INCOME
99.9/ 100
METRIC RATING
52nd/ 347
METRIC RANK
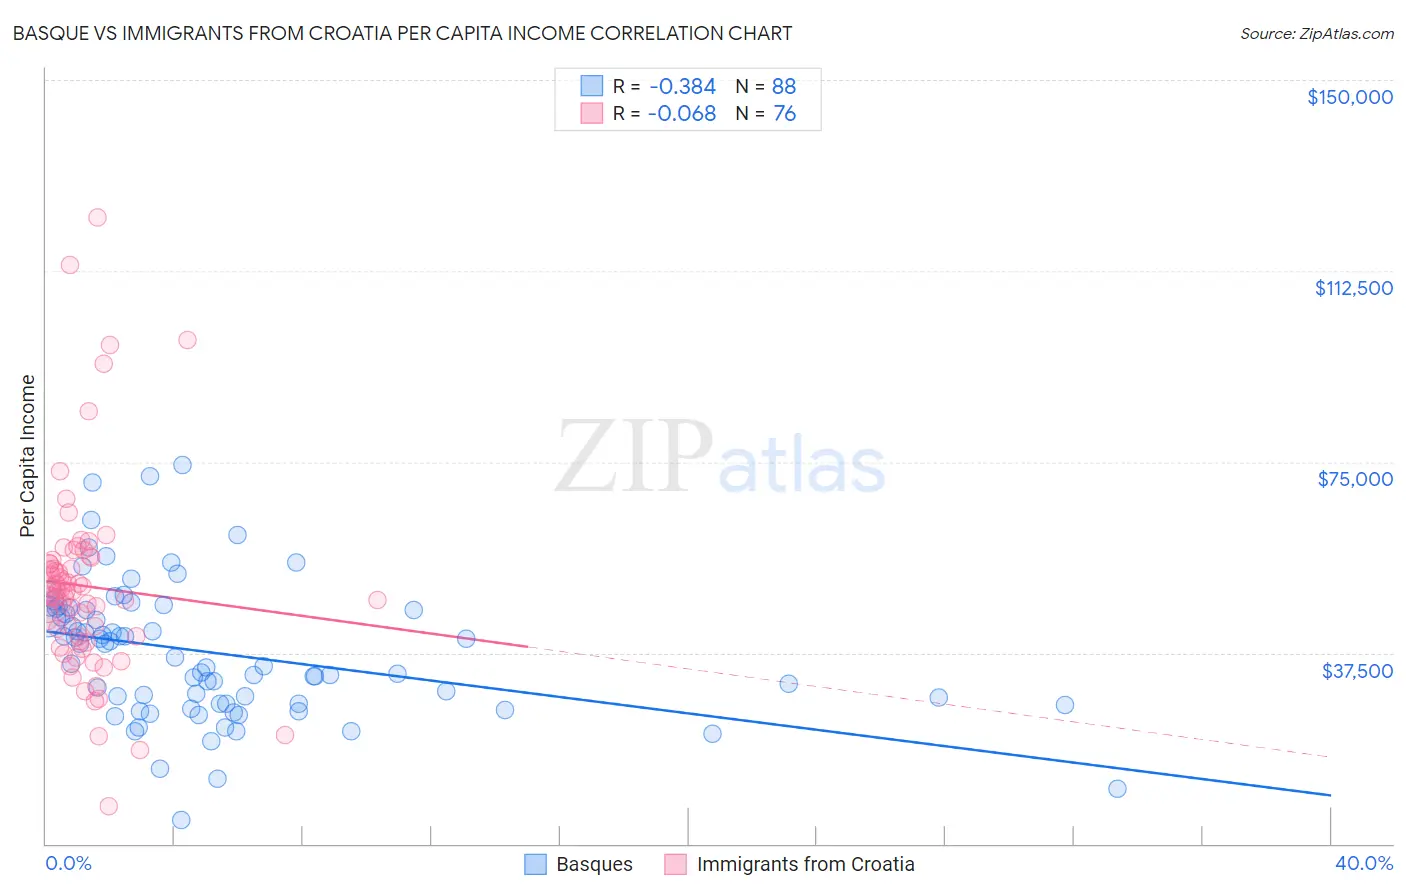
Basque vs Immigrants from Croatia Per Capita Income Correlation Chart
The statistical analysis conducted on geographies consisting of 165,779,827 people shows a mild negative correlation between the proportion of Basques and per capita income in the United States with a correlation coefficient (R) of -0.384 and weighted average of $45,086. Similarly, the statistical analysis conducted on geographies consisting of 132,568,979 people shows a slight negative correlation between the proportion of Immigrants from Croatia and per capita income in the United States with a correlation coefficient (R) of -0.068 and weighted average of $50,417, a difference of 11.8%.
Per Capita Income Correlation Summary
| Measurement | Basque | Immigrants from Croatia |
| Minimum | $4,617 | $7,427 |
| Maximum | $74,412 | $123,040 |
| Range | $69,795 | $115,613 |
| Mean | $37,448 | $50,621 |
| Median | $35,882 | $49,179 |
| Interquartile 25% (IQ1) | $27,463 | $40,218 |
| Interquartile 75% (IQ3) | $46,112 | $55,379 |
| Interquartile Range (IQR) | $18,649 | $15,162 |
| Standard Deviation (Sample) | $13,380 | $19,242 |
| Standard Deviation (Population) | $13,304 | $19,115 |
Similar Demographics by Per Capita Income
Demographics Similar to Basques by Per Capita Income
In terms of per capita income, the demographic groups most similar to Basques are Immigrants from Jordan ($45,066, a difference of 0.050%), Slavic ($45,049, a difference of 0.080%), Ugandan ($45,047, a difference of 0.090%), Immigrants from Uganda ($45,043, a difference of 0.10%), and Icelander ($44,987, a difference of 0.22%).
| Demographics | Rating | Rank | Per Capita Income |
| Jordanians | 89.9 /100 | #132 | Excellent $45,605 |
| Pakistanis | 89.7 /100 | #133 | Excellent $45,587 |
| Slovenes | 89.6 /100 | #134 | Excellent $45,581 |
| Hungarians | 87.9 /100 | #135 | Excellent $45,426 |
| Immigrants | Oceania | 85.2 /100 | #136 | Excellent $45,220 |
| Immigrants | Syria | 85.2 /100 | #137 | Excellent $45,218 |
| Assyrians/Chaldeans/Syriacs | 84.8 /100 | #138 | Excellent $45,195 |
| Basques | 83.2 /100 | #139 | Excellent $45,086 |
| Immigrants | Jordan | 82.9 /100 | #140 | Excellent $45,066 |
| Slavs | 82.6 /100 | #141 | Excellent $45,049 |
| Ugandans | 82.6 /100 | #142 | Excellent $45,047 |
| Immigrants | Uganda | 82.5 /100 | #143 | Excellent $45,043 |
| Icelanders | 81.6 /100 | #144 | Excellent $44,987 |
| Immigrants | Afghanistan | 78.0 /100 | #145 | Good $44,790 |
| Irish | 75.8 /100 | #146 | Good $44,679 |
Demographics Similar to Immigrants from Croatia by Per Capita Income
In terms of per capita income, the demographic groups most similar to Immigrants from Croatia are Paraguayan ($50,385, a difference of 0.060%), Immigrants from Netherlands ($50,458, a difference of 0.080%), Immigrants from Belarus ($50,303, a difference of 0.23%), Immigrants from Sri Lanka ($50,555, a difference of 0.27%), and New Zealander ($50,575, a difference of 0.31%).
| Demographics | Rating | Rank | Per Capita Income |
| Immigrants | Spain | 100.0 /100 | #45 | Exceptional $50,933 |
| Immigrants | Latvia | 100.0 /100 | #46 | Exceptional $50,914 |
| Bulgarians | 100.0 /100 | #47 | Exceptional $50,906 |
| Immigrants | Serbia | 100.0 /100 | #48 | Exceptional $50,810 |
| New Zealanders | 100.0 /100 | #49 | Exceptional $50,575 |
| Immigrants | Sri Lanka | 100.0 /100 | #50 | Exceptional $50,555 |
| Immigrants | Netherlands | 100.0 /100 | #51 | Exceptional $50,458 |
| Immigrants | Croatia | 99.9 /100 | #52 | Exceptional $50,417 |
| Paraguayans | 99.9 /100 | #53 | Exceptional $50,385 |
| Immigrants | Belarus | 99.9 /100 | #54 | Exceptional $50,303 |
| Immigrants | Western Europe | 99.9 /100 | #55 | Exceptional $50,065 |
| Asians | 99.9 /100 | #56 | Exceptional $50,057 |
| South Africans | 99.9 /100 | #57 | Exceptional $50,044 |
| Immigrants | Malaysia | 99.9 /100 | #58 | Exceptional $49,983 |
| Bhutanese | 99.9 /100 | #59 | Exceptional $49,894 |