Czechoslovakian vs Immigrants from Zaire Ambulatory Disability
COMPARE
Czechoslovakian
Immigrants from Zaire
Ambulatory Disability
Ambulatory Disability Comparison
Czechoslovakians
Immigrants from Zaire
6.4%
AMBULATORY DISABILITY
3.8/ 100
METRIC RATING
229th/ 347
METRIC RANK
6.0%
AMBULATORY DISABILITY
83.6/ 100
METRIC RATING
139th/ 347
METRIC RANK
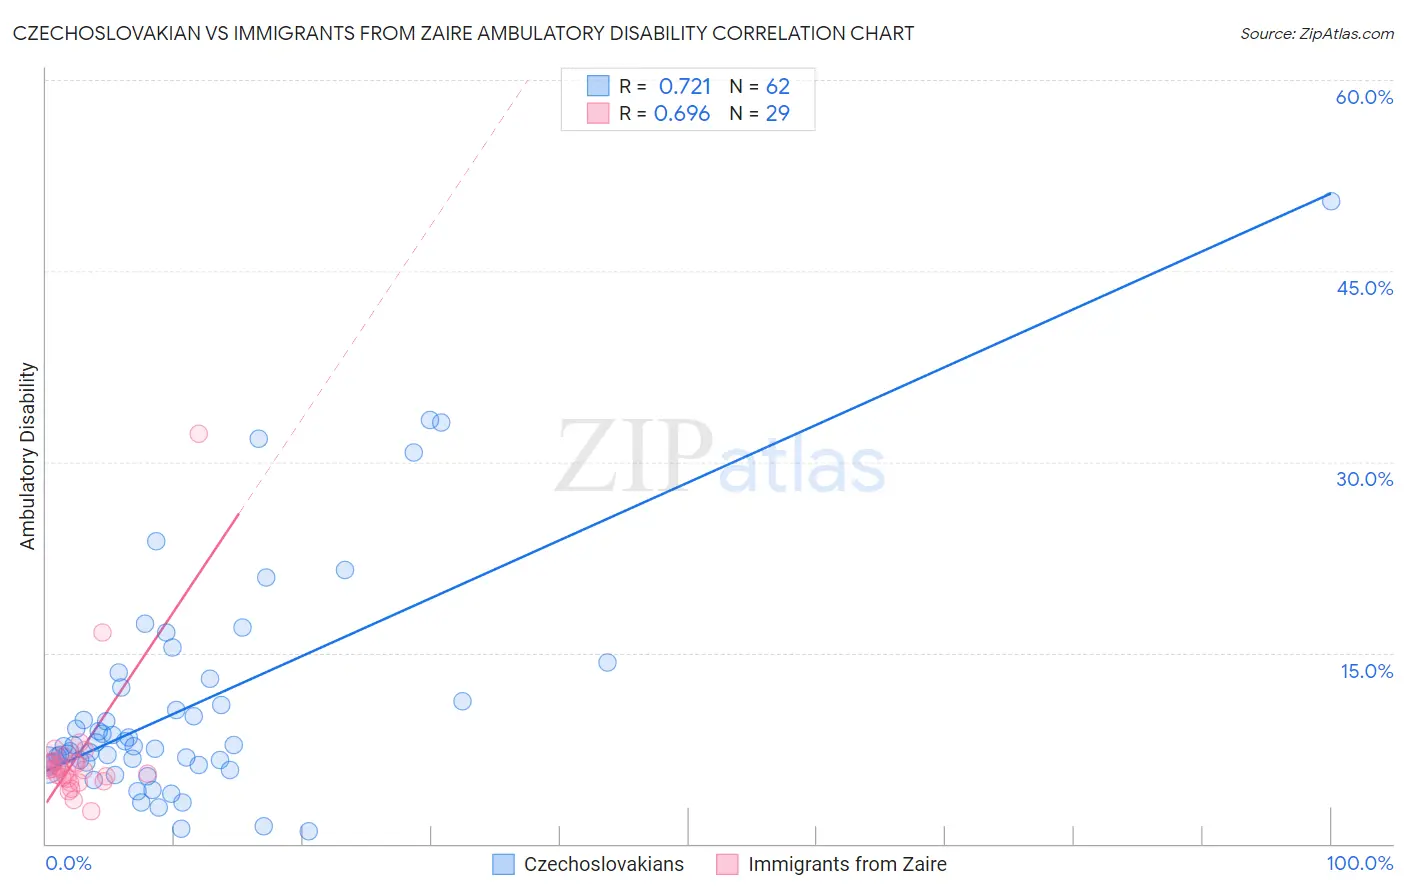
Czechoslovakian vs Immigrants from Zaire Ambulatory Disability Correlation Chart
The statistical analysis conducted on geographies consisting of 368,636,980 people shows a strong positive correlation between the proportion of Czechoslovakians and percentage of population with ambulatory disability in the United States with a correlation coefficient (R) of 0.721 and weighted average of 6.4%. Similarly, the statistical analysis conducted on geographies consisting of 107,247,600 people shows a significant positive correlation between the proportion of Immigrants from Zaire and percentage of population with ambulatory disability in the United States with a correlation coefficient (R) of 0.696 and weighted average of 6.0%, a difference of 6.6%.
Ambulatory Disability Correlation Summary
| Measurement | Czechoslovakian | Immigrants from Zaire |
| Minimum | 0.94% | 2.5% |
| Maximum | 50.5% | 32.2% |
| Range | 49.6% | 29.6% |
| Mean | 10.8% | 6.9% |
| Median | 7.7% | 5.8% |
| Interquartile 25% (IQ1) | 6.3% | 5.0% |
| Interquartile 75% (IQ3) | 12.3% | 6.4% |
| Interquartile Range (IQR) | 6.0% | 1.4% |
| Standard Deviation (Sample) | 9.1% | 5.4% |
| Standard Deviation (Population) | 9.0% | 5.3% |
Similar Demographics by Ambulatory Disability
Demographics Similar to Czechoslovakians by Ambulatory Disability
In terms of ambulatory disability, the demographic groups most similar to Czechoslovakians are Portuguese (6.4%, a difference of 0.050%), Cuban (6.4%, a difference of 0.060%), Mexican (6.4%, a difference of 0.11%), Panamanian (6.4%, a difference of 0.26%), and Slavic (6.4%, a difference of 0.39%).
| Demographics | Rating | Rank | Ambulatory Disability |
| German Russians | 9.4 /100 | #222 | Tragic 6.3% |
| Immigrants | Honduras | 7.6 /100 | #223 | Tragic 6.3% |
| Liberians | 7.1 /100 | #224 | Tragic 6.3% |
| Hondurans | 6.3 /100 | #225 | Tragic 6.3% |
| Slavs | 5.1 /100 | #226 | Tragic 6.4% |
| Cubans | 4.0 /100 | #227 | Tragic 6.4% |
| Portuguese | 4.0 /100 | #228 | Tragic 6.4% |
| Czechoslovakians | 3.8 /100 | #229 | Tragic 6.4% |
| Mexicans | 3.5 /100 | #230 | Tragic 6.4% |
| Panamanians | 3.1 /100 | #231 | Tragic 6.4% |
| Assyrians/Chaldeans/Syriacs | 2.4 /100 | #232 | Tragic 6.4% |
| Sub-Saharan Africans | 2.3 /100 | #233 | Tragic 6.4% |
| Immigrants | Liberia | 2.3 /100 | #234 | Tragic 6.4% |
| Hispanics or Latinos | 2.2 /100 | #235 | Tragic 6.4% |
| Dutch | 2.0 /100 | #236 | Tragic 6.4% |
Demographics Similar to Immigrants from Zaire by Ambulatory Disability
In terms of ambulatory disability, the demographic groups most similar to Immigrants from Zaire are Immigrants from Hungary (6.0%, a difference of 0.030%), Czech (6.0%, a difference of 0.030%), Immigrants from North Macedonia (6.0%, a difference of 0.050%), Immigrants from Syria (6.0%, a difference of 0.050%), and Swedish (6.0%, a difference of 0.050%).
| Demographics | Rating | Rank | Ambulatory Disability |
| Immigrants | Europe | 87.8 /100 | #132 | Excellent 6.0% |
| Immigrants | Immigrants | 86.9 /100 | #133 | Excellent 6.0% |
| Ute | 86.6 /100 | #134 | Excellent 6.0% |
| Immigrants | Italy | 85.0 /100 | #135 | Excellent 6.0% |
| Immigrants | North Macedonia | 84.1 /100 | #136 | Excellent 6.0% |
| Immigrants | Syria | 84.1 /100 | #137 | Excellent 6.0% |
| Immigrants | Hungary | 83.9 /100 | #138 | Excellent 6.0% |
| Immigrants | Zaire | 83.6 /100 | #139 | Excellent 6.0% |
| Czechs | 83.3 /100 | #140 | Excellent 6.0% |
| Swedes | 83.1 /100 | #141 | Excellent 6.0% |
| Immigrants | Philippines | 83.0 /100 | #142 | Excellent 6.0% |
| Romanians | 82.9 /100 | #143 | Excellent 6.0% |
| Macedonians | 82.8 /100 | #144 | Excellent 6.0% |
| Pakistanis | 82.5 /100 | #145 | Excellent 6.0% |
| Immigrants | Greece | 82.5 /100 | #146 | Excellent 6.0% |