Bahamian vs Immigrants from Zaire Median Household Income
COMPARE
Bahamian
Immigrants from Zaire
Median Household Income
Median Household Income Comparison
Bahamians
Immigrants from Zaire
$69,726
MEDIAN HOUSEHOLD INCOME
0.0/ 100
METRIC RATING
323rd/ 347
METRIC RANK
$71,801
MEDIAN HOUSEHOLD INCOME
0.0/ 100
METRIC RATING
311th/ 347
METRIC RANK
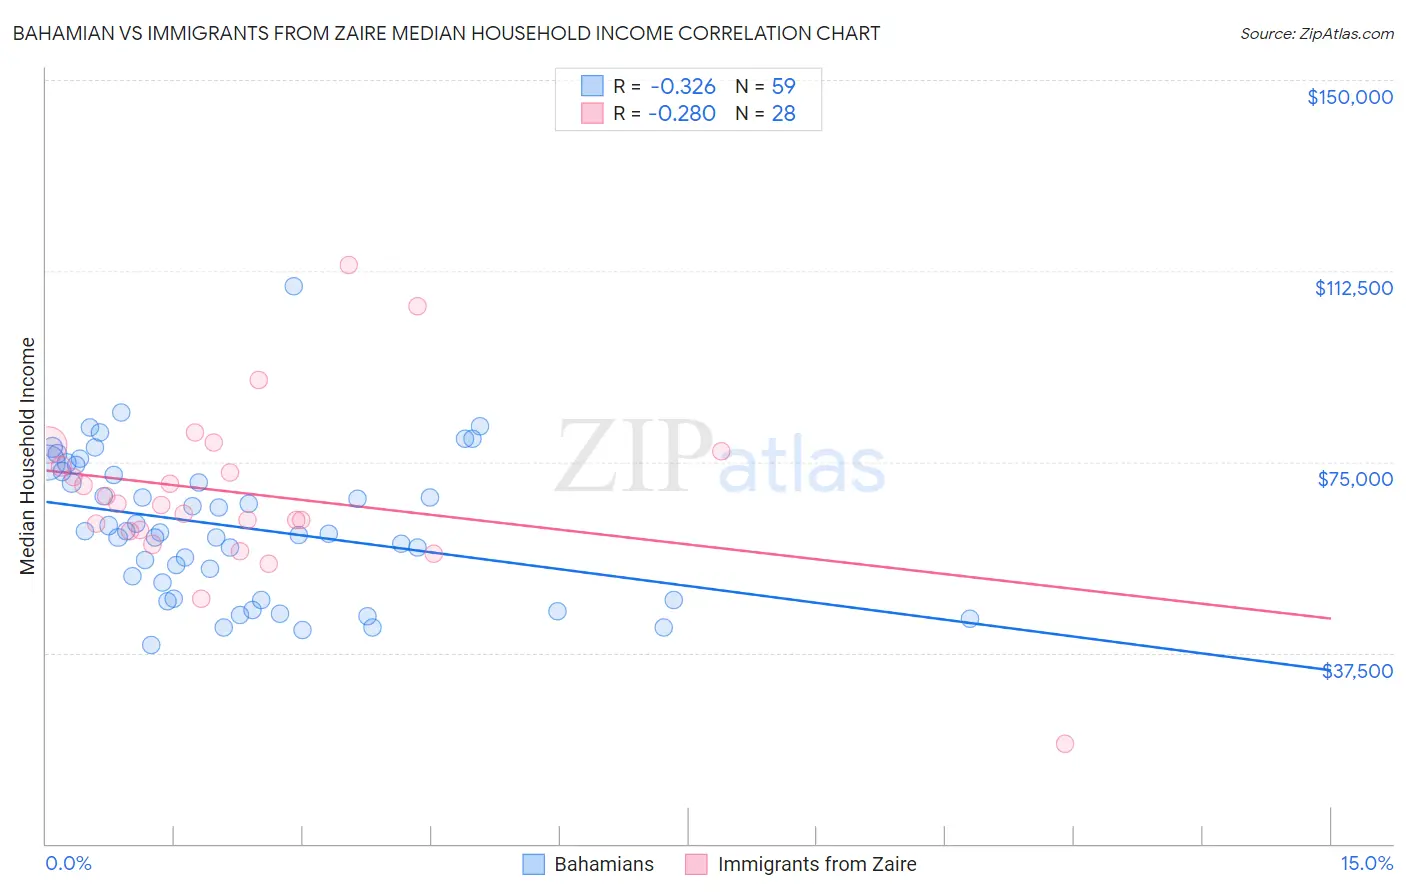
Bahamian vs Immigrants from Zaire Median Household Income Correlation Chart
The statistical analysis conducted on geographies consisting of 112,607,468 people shows a mild negative correlation between the proportion of Bahamians and median household income in the United States with a correlation coefficient (R) of -0.326 and weighted average of $69,726. Similarly, the statistical analysis conducted on geographies consisting of 107,241,682 people shows a weak negative correlation between the proportion of Immigrants from Zaire and median household income in the United States with a correlation coefficient (R) of -0.280 and weighted average of $71,801, a difference of 3.0%.
Median Household Income Correlation Summary
| Measurement | Bahamian | Immigrants from Zaire |
| Minimum | $38,952 | $19,722 |
| Maximum | $109,393 | $113,664 |
| Range | $70,441 | $93,942 |
| Mean | $62,193 | $68,739 |
| Median | $61,085 | $66,729 |
| Interquartile 25% (IQ1) | $48,214 | $61,417 |
| Interquartile 75% (IQ3) | $73,042 | $75,692 |
| Interquartile Range (IQR) | $24,828 | $14,275 |
| Standard Deviation (Sample) | $14,104 | $17,188 |
| Standard Deviation (Population) | $13,984 | $16,878 |
Demographics Similar to Bahamians and Immigrants from Zaire by Median Household Income
In terms of median household income, the demographic groups most similar to Bahamians are Yup'ik ($69,695, a difference of 0.040%), Choctaw ($69,947, a difference of 0.32%), Chickasaw ($70,005, a difference of 0.40%), Seminole ($69,420, a difference of 0.44%), and Colville ($70,094, a difference of 0.53%). Similarly, the demographic groups most similar to Immigrants from Zaire are U.S. Virgin Islander ($71,853, a difference of 0.070%), Immigrants from Caribbean ($71,860, a difference of 0.080%), Immigrants from Honduras ($71,452, a difference of 0.49%), Yakama ($72,225, a difference of 0.59%), and Immigrants from Bahamas ($71,349, a difference of 0.63%).
| Demographics | Rating | Rank | Median Household Income |
| Ute | 0.0 /100 | #307 | Tragic $72,402 |
| Yakama | 0.0 /100 | #308 | Tragic $72,225 |
| Immigrants | Caribbean | 0.0 /100 | #309 | Tragic $71,860 |
| U.S. Virgin Islanders | 0.0 /100 | #310 | Tragic $71,853 |
| Immigrants | Zaire | 0.0 /100 | #311 | Tragic $71,801 |
| Immigrants | Honduras | 0.0 /100 | #312 | Tragic $71,452 |
| Immigrants | Bahamas | 0.0 /100 | #313 | Tragic $71,349 |
| Dominicans | 0.0 /100 | #314 | Tragic $71,302 |
| Ottawa | 0.0 /100 | #315 | Tragic $70,984 |
| Apache | 0.0 /100 | #316 | Tragic $70,927 |
| Cajuns | 0.0 /100 | #317 | Tragic $70,605 |
| Chippewa | 0.0 /100 | #318 | Tragic $70,539 |
| Immigrants | Dominican Republic | 0.0 /100 | #319 | Tragic $70,208 |
| Colville | 0.0 /100 | #320 | Tragic $70,094 |
| Chickasaw | 0.0 /100 | #321 | Tragic $70,005 |
| Choctaw | 0.0 /100 | #322 | Tragic $69,947 |
| Bahamians | 0.0 /100 | #323 | Tragic $69,726 |
| Yup'ik | 0.0 /100 | #324 | Tragic $69,695 |
| Seminole | 0.0 /100 | #325 | Tragic $69,420 |
| Yuman | 0.0 /100 | #326 | Tragic $68,743 |
| Immigrants | Cuba | 0.0 /100 | #327 | Tragic $68,461 |