Shoshone vs Immigrants from Zaire Median Household Income
COMPARE
Shoshone
Immigrants from Zaire
Median Household Income
Median Household Income Comparison
Shoshone
Immigrants from Zaire
$72,660
MEDIAN HOUSEHOLD INCOME
0.0/ 100
METRIC RATING
302nd/ 347
METRIC RANK
$71,801
MEDIAN HOUSEHOLD INCOME
0.0/ 100
METRIC RATING
311th/ 347
METRIC RANK
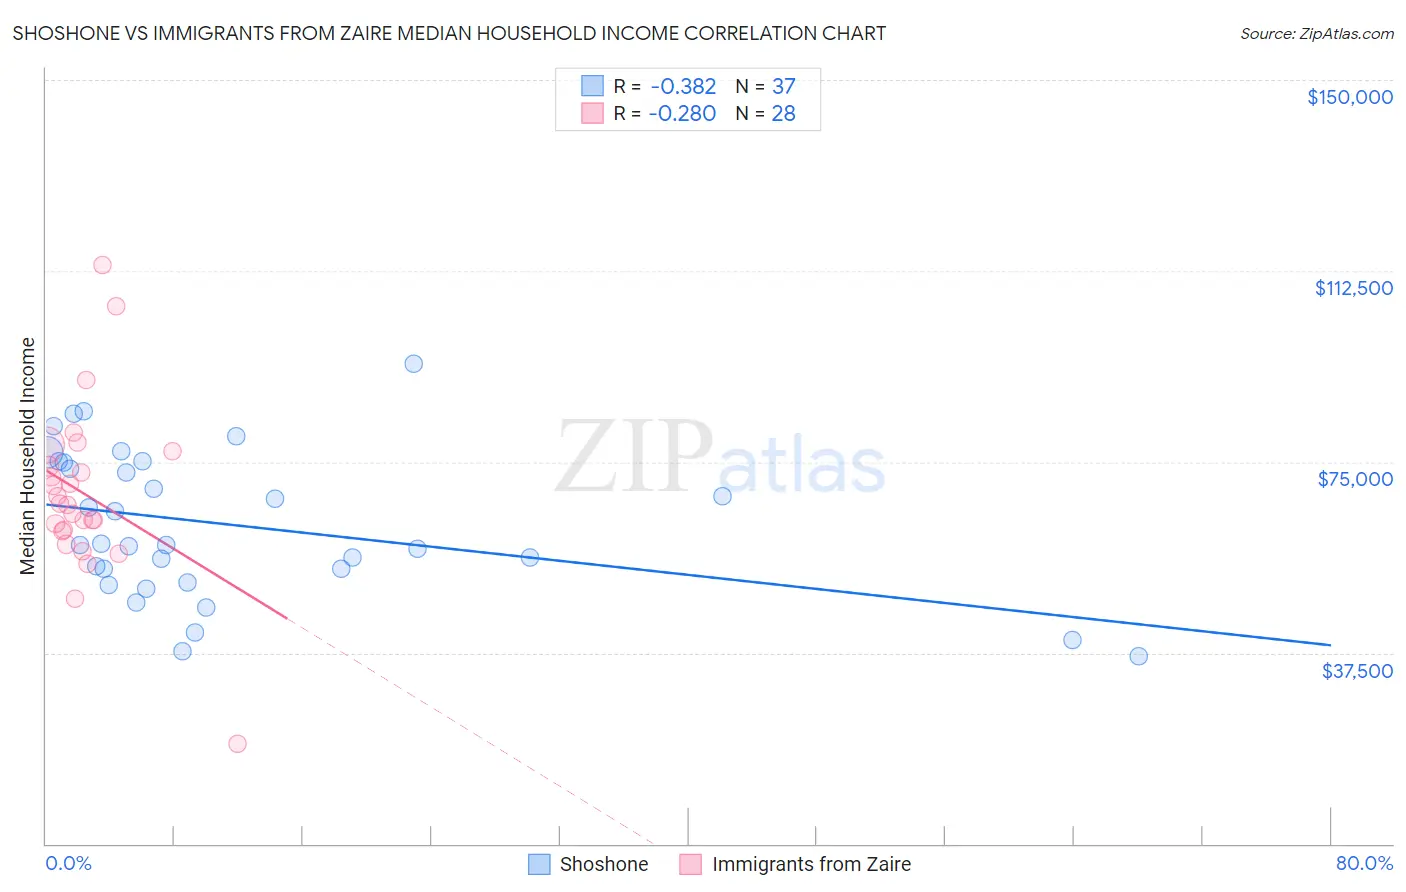
Shoshone vs Immigrants from Zaire Median Household Income Correlation Chart
The statistical analysis conducted on geographies consisting of 66,612,449 people shows a mild negative correlation between the proportion of Shoshone and median household income in the United States with a correlation coefficient (R) of -0.382 and weighted average of $72,660. Similarly, the statistical analysis conducted on geographies consisting of 107,241,682 people shows a weak negative correlation between the proportion of Immigrants from Zaire and median household income in the United States with a correlation coefficient (R) of -0.280 and weighted average of $71,801, a difference of 1.2%.
Median Household Income Correlation Summary
| Measurement | Shoshone | Immigrants from Zaire |
| Minimum | $36,823 | $19,722 |
| Maximum | $94,375 | $113,664 |
| Range | $57,552 | $93,942 |
| Mean | $62,559 | $68,739 |
| Median | $58,750 | $66,729 |
| Interquartile 25% (IQ1) | $52,629 | $61,417 |
| Interquartile 75% (IQ3) | $75,002 | $75,692 |
| Interquartile Range (IQR) | $22,372 | $14,275 |
| Standard Deviation (Sample) | $14,416 | $17,188 |
| Standard Deviation (Population) | $14,219 | $16,878 |
Demographics Similar to Shoshone and Immigrants from Zaire by Median Household Income
In terms of median household income, the demographic groups most similar to Shoshone are African ($72,650, a difference of 0.010%), Cherokee ($72,682, a difference of 0.030%), Immigrants from Haiti ($72,599, a difference of 0.080%), Honduran ($72,588, a difference of 0.10%), and Potawatomi ($72,576, a difference of 0.12%). Similarly, the demographic groups most similar to Immigrants from Zaire are U.S. Virgin Islander ($71,853, a difference of 0.070%), Immigrants from Caribbean ($71,860, a difference of 0.080%), Immigrants from Honduras ($71,452, a difference of 0.49%), Yakama ($72,225, a difference of 0.59%), and Immigrants from Bahamas ($71,349, a difference of 0.63%).
| Demographics | Rating | Rank | Median Household Income |
| Haitians | 0.1 /100 | #296 | Tragic $73,306 |
| Immigrants | Mexico | 0.0 /100 | #297 | Tragic $73,160 |
| Paiute | 0.0 /100 | #298 | Tragic $72,959 |
| Indonesians | 0.0 /100 | #299 | Tragic $72,856 |
| Immigrants | Dominica | 0.0 /100 | #300 | Tragic $72,760 |
| Cherokee | 0.0 /100 | #301 | Tragic $72,682 |
| Shoshone | 0.0 /100 | #302 | Tragic $72,660 |
| Africans | 0.0 /100 | #303 | Tragic $72,650 |
| Immigrants | Haiti | 0.0 /100 | #304 | Tragic $72,599 |
| Hondurans | 0.0 /100 | #305 | Tragic $72,588 |
| Potawatomi | 0.0 /100 | #306 | Tragic $72,576 |
| Ute | 0.0 /100 | #307 | Tragic $72,402 |
| Yakama | 0.0 /100 | #308 | Tragic $72,225 |
| Immigrants | Caribbean | 0.0 /100 | #309 | Tragic $71,860 |
| U.S. Virgin Islanders | 0.0 /100 | #310 | Tragic $71,853 |
| Immigrants | Zaire | 0.0 /100 | #311 | Tragic $71,801 |
| Immigrants | Honduras | 0.0 /100 | #312 | Tragic $71,452 |
| Immigrants | Bahamas | 0.0 /100 | #313 | Tragic $71,349 |
| Dominicans | 0.0 /100 | #314 | Tragic $71,302 |
| Ottawa | 0.0 /100 | #315 | Tragic $70,984 |
| Apache | 0.0 /100 | #316 | Tragic $70,927 |