Swedish vs Albanian Median Household Income
COMPARE
Swedish
Albanian
Median Household Income
Median Household Income Comparison
Swedes
Albanians
$88,524
MEDIAN HOUSEHOLD INCOME
90.0/ 100
METRIC RATING
134th/ 347
METRIC RANK
$89,744
MEDIAN HOUSEHOLD INCOME
95.2/ 100
METRIC RATING
119th/ 347
METRIC RANK
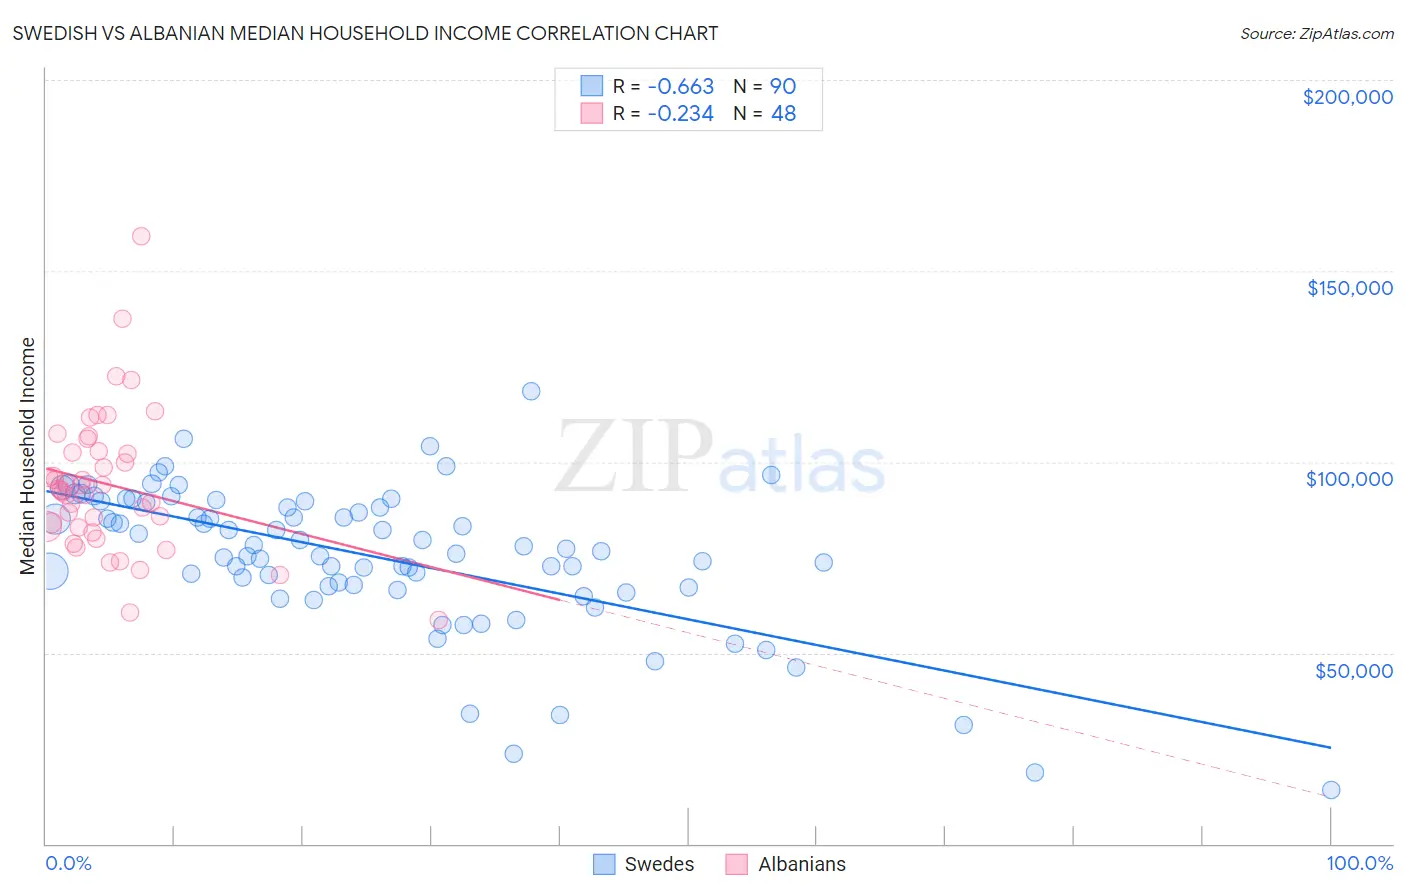
Swedish vs Albanian Median Household Income Correlation Chart
The statistical analysis conducted on geographies consisting of 538,472,836 people shows a significant negative correlation between the proportion of Swedes and median household income in the United States with a correlation coefficient (R) of -0.663 and weighted average of $88,524. Similarly, the statistical analysis conducted on geographies consisting of 193,153,779 people shows a weak negative correlation between the proportion of Albanians and median household income in the United States with a correlation coefficient (R) of -0.234 and weighted average of $89,744, a difference of 1.4%.
Median Household Income Correlation Summary
| Measurement | Swedish | Albanian |
| Minimum | $14,107 | $58,625 |
| Maximum | $118,333 | $159,242 |
| Range | $104,226 | $100,617 |
| Mean | $75,217 | $94,169 |
| Median | $76,969 | $92,779 |
| Interquartile 25% (IQ1) | $67,408 | $83,032 |
| Interquartile 75% (IQ3) | $89,464 | $102,632 |
| Interquartile Range (IQR) | $22,056 | $19,600 |
| Standard Deviation (Sample) | $18,981 | $18,349 |
| Standard Deviation (Population) | $18,875 | $18,157 |
Demographics Similar to Swedes and Albanians by Median Household Income
In terms of median household income, the demographic groups most similar to Swedes are Immigrants from Sierra Leone ($88,498, a difference of 0.030%), Polish ($88,472, a difference of 0.060%), Immigrants from Ethiopia ($88,687, a difference of 0.18%), European ($88,751, a difference of 0.26%), and Immigrants from Syria ($88,792, a difference of 0.30%). Similarly, the demographic groups most similar to Albanians are Immigrants from North Macedonia ($89,741, a difference of 0.0%), Syrian ($89,830, a difference of 0.10%), Ethiopian ($89,640, a difference of 0.12%), Pakistani ($89,638, a difference of 0.12%), and Taiwanese ($89,900, a difference of 0.17%).
| Demographics | Rating | Rank | Median Household Income |
| Native Hawaiians | 95.7 /100 | #116 | Exceptional $89,919 |
| Taiwanese | 95.6 /100 | #117 | Exceptional $89,900 |
| Syrians | 95.4 /100 | #118 | Exceptional $89,830 |
| Albanians | 95.2 /100 | #119 | Exceptional $89,744 |
| Immigrants | North Macedonia | 95.2 /100 | #120 | Exceptional $89,741 |
| Ethiopians | 94.9 /100 | #121 | Exceptional $89,640 |
| Pakistanis | 94.8 /100 | #122 | Exceptional $89,638 |
| Immigrants | Zimbabwe | 94.4 /100 | #123 | Exceptional $89,496 |
| Immigrants | Jordan | 94.1 /100 | #124 | Exceptional $89,412 |
| Immigrants | Kuwait | 93.5 /100 | #125 | Exceptional $89,263 |
| Immigrants | Oceania | 92.9 /100 | #126 | Exceptional $89,100 |
| Immigrants | Peru | 92.5 /100 | #127 | Exceptional $89,010 |
| Portuguese | 92.3 /100 | #128 | Exceptional $88,976 |
| Brazilians | 92.1 /100 | #129 | Exceptional $88,934 |
| British | 92.0 /100 | #130 | Exceptional $88,914 |
| Immigrants | Syria | 91.4 /100 | #131 | Exceptional $88,792 |
| Europeans | 91.2 /100 | #132 | Exceptional $88,751 |
| Immigrants | Ethiopia | 90.9 /100 | #133 | Exceptional $88,687 |
| Swedes | 90.0 /100 | #134 | Exceptional $88,524 |
| Immigrants | Sierra Leone | 89.9 /100 | #135 | Excellent $88,498 |
| Poles | 89.7 /100 | #136 | Excellent $88,472 |