Crow vs Colombian Median Male Earnings
COMPARE
Crow
Colombian
Median Male Earnings
Median Male Earnings Comparison
Crow
Colombians
$42,434
MEDIAN MALE EARNINGS
0.0/ 100
METRIC RATING
338th/ 347
METRIC RANK
$53,832
MEDIAN MALE EARNINGS
34.4/ 100
METRIC RATING
186th/ 347
METRIC RANK
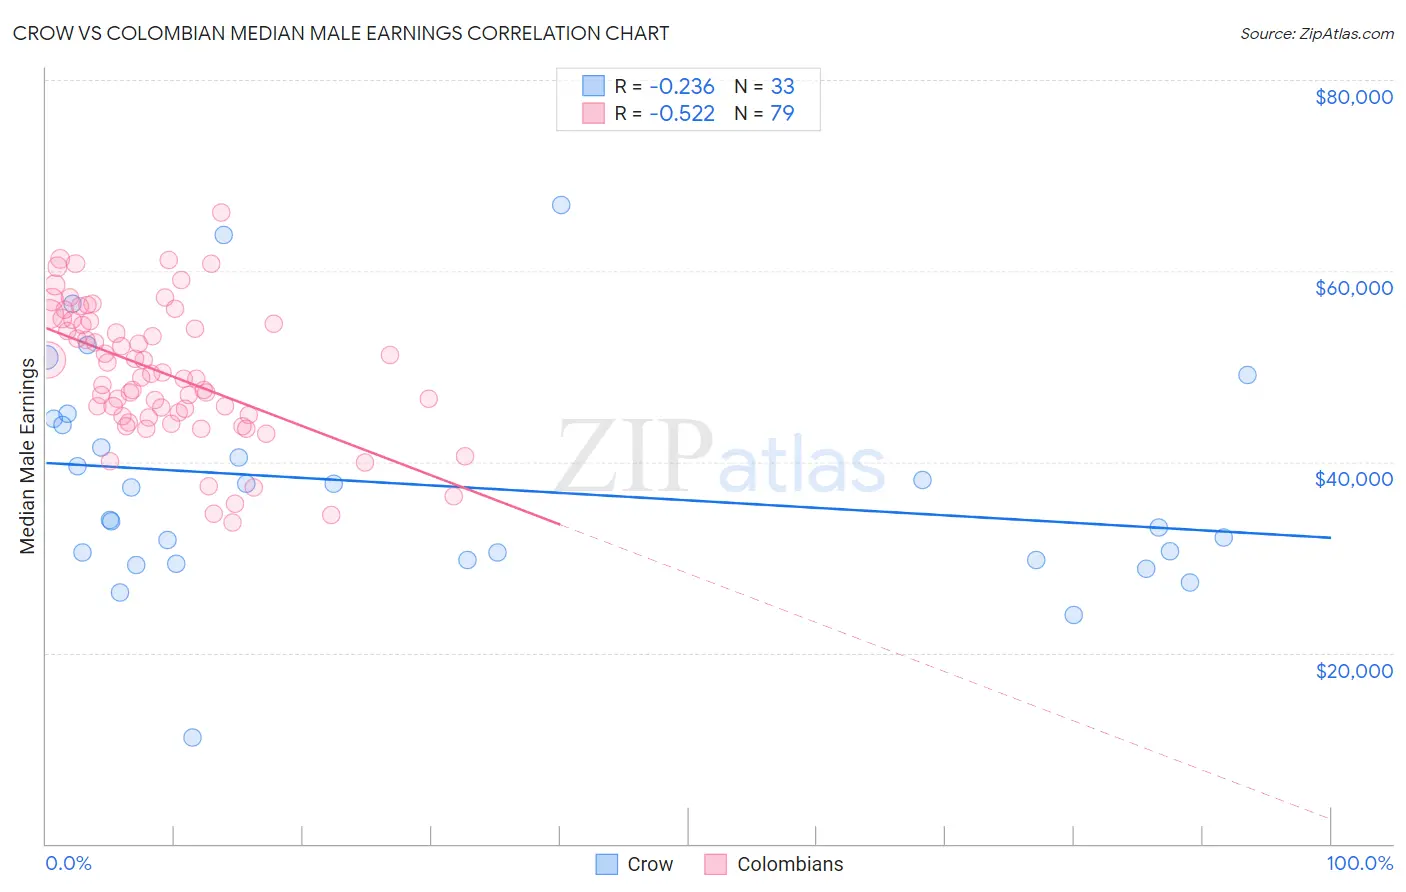
Crow vs Colombian Median Male Earnings Correlation Chart
The statistical analysis conducted on geographies consisting of 59,199,884 people shows a weak negative correlation between the proportion of Crow and median male earnings in the United States with a correlation coefficient (R) of -0.236 and weighted average of $42,434. Similarly, the statistical analysis conducted on geographies consisting of 419,486,746 people shows a substantial negative correlation between the proportion of Colombians and median male earnings in the United States with a correlation coefficient (R) of -0.522 and weighted average of $53,832, a difference of 26.9%.
Median Male Earnings Correlation Summary
| Measurement | Crow | Colombian |
| Minimum | $11,094 | $33,656 |
| Maximum | $66,875 | $66,073 |
| Range | $55,781 | $32,417 |
| Mean | $37,474 | $49,309 |
| Median | $33,966 | $48,805 |
| Interquartile 25% (IQ1) | $29,676 | $44,741 |
| Interquartile 75% (IQ3) | $44,202 | $54,777 |
| Interquartile Range (IQR) | $14,526 | $10,037 |
| Standard Deviation (Sample) | $11,614 | $7,074 |
| Standard Deviation (Population) | $11,436 | $7,029 |
Similar Demographics by Median Male Earnings
Demographics Similar to Crow by Median Male Earnings
In terms of median male earnings, the demographic groups most similar to Crow are Pima ($42,357, a difference of 0.18%), Menominee ($42,581, a difference of 0.35%), Navajo ($42,098, a difference of 0.80%), Hopi ($42,060, a difference of 0.89%), and Arapaho ($41,758, a difference of 1.6%).
| Demographics | Rating | Rank | Median Male Earnings |
| Natives/Alaskans | 0.0 /100 | #331 | Tragic $44,775 |
| Bahamians | 0.0 /100 | #332 | Tragic $44,756 |
| Immigrants | Congo | 0.0 /100 | #333 | Tragic $44,204 |
| Immigrants | Yemen | 0.0 /100 | #334 | Tragic $44,083 |
| Spanish American Indians | 0.0 /100 | #335 | Tragic $44,010 |
| Immigrants | Cuba | 0.0 /100 | #336 | Tragic $43,461 |
| Menominee | 0.0 /100 | #337 | Tragic $42,581 |
| Crow | 0.0 /100 | #338 | Tragic $42,434 |
| Pima | 0.0 /100 | #339 | Tragic $42,357 |
| Navajo | 0.0 /100 | #340 | Tragic $42,098 |
| Hopi | 0.0 /100 | #341 | Tragic $42,060 |
| Arapaho | 0.0 /100 | #342 | Tragic $41,758 |
| Lumbee | 0.0 /100 | #343 | Tragic $41,715 |
| Pueblo | 0.0 /100 | #344 | Tragic $41,314 |
| Puerto Ricans | 0.0 /100 | #345 | Tragic $40,071 |
Demographics Similar to Colombians by Median Male Earnings
In terms of median male earnings, the demographic groups most similar to Colombians are Immigrants from Sierra Leone ($53,905, a difference of 0.14%), White/Caucasian ($53,925, a difference of 0.17%), Immigrants from Eritrea ($53,715, a difference of 0.22%), Immigrants from Eastern Africa ($53,713, a difference of 0.22%), and Immigrants from South America ($53,962, a difference of 0.24%).
| Demographics | Rating | Rank | Median Male Earnings |
| Celtics | 43.9 /100 | #179 | Average $54,242 |
| Iraqis | 42.5 /100 | #180 | Average $54,182 |
| Immigrants | Immigrants | 42.1 /100 | #181 | Average $54,168 |
| Yugoslavians | 37.4 /100 | #182 | Fair $53,967 |
| Immigrants | South America | 37.3 /100 | #183 | Fair $53,962 |
| Whites/Caucasians | 36.5 /100 | #184 | Fair $53,925 |
| Immigrants | Sierra Leone | 36.0 /100 | #185 | Fair $53,905 |
| Colombians | 34.4 /100 | #186 | Fair $53,832 |
| Immigrants | Eritrea | 31.8 /100 | #187 | Fair $53,715 |
| Immigrants | Eastern Africa | 31.8 /100 | #188 | Fair $53,713 |
| Puget Sound Salish | 31.6 /100 | #189 | Fair $53,704 |
| Uruguayans | 31.1 /100 | #190 | Fair $53,680 |
| Guamanians/Chamorros | 30.7 /100 | #191 | Fair $53,661 |
| Scotch-Irish | 30.6 /100 | #192 | Fair $53,658 |
| Kenyans | 30.4 /100 | #193 | Fair $53,647 |