Crow vs Immigrants from Liberia Median Male Earnings
COMPARE
Crow
Immigrants from Liberia
Median Male Earnings
Median Male Earnings Comparison
Crow
Immigrants from Liberia
$42,434
MEDIAN MALE EARNINGS
0.0/ 100
METRIC RATING
338th/ 347
METRIC RANK
$48,317
MEDIAN MALE EARNINGS
0.2/ 100
METRIC RATING
278th/ 347
METRIC RANK
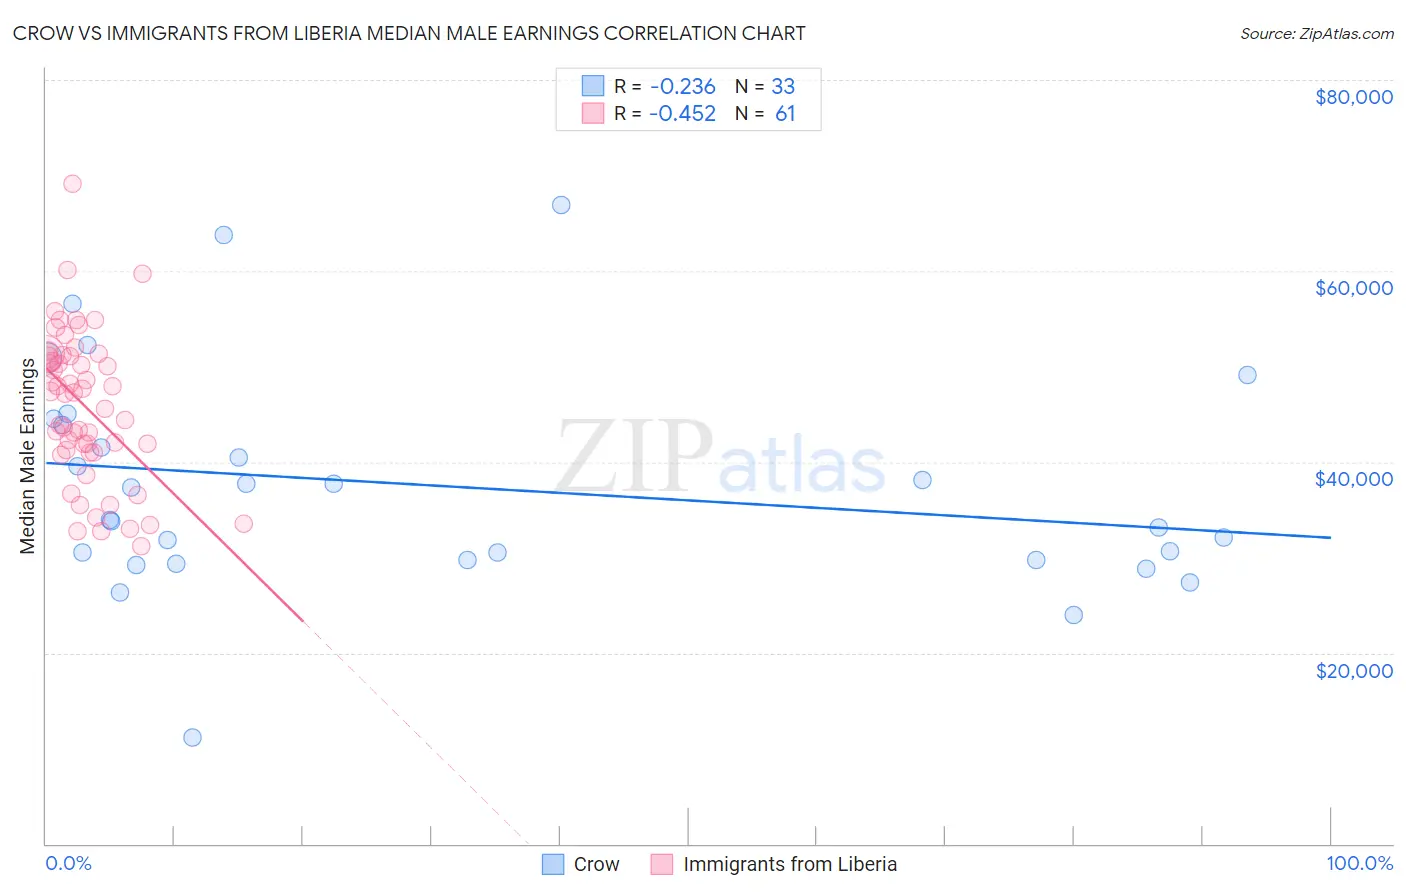
Crow vs Immigrants from Liberia Median Male Earnings Correlation Chart
The statistical analysis conducted on geographies consisting of 59,199,884 people shows a weak negative correlation between the proportion of Crow and median male earnings in the United States with a correlation coefficient (R) of -0.236 and weighted average of $42,434. Similarly, the statistical analysis conducted on geographies consisting of 135,282,382 people shows a moderate negative correlation between the proportion of Immigrants from Liberia and median male earnings in the United States with a correlation coefficient (R) of -0.452 and weighted average of $48,317, a difference of 13.9%.
Median Male Earnings Correlation Summary
| Measurement | Crow | Immigrants from Liberia |
| Minimum | $11,094 | $31,133 |
| Maximum | $66,875 | $69,167 |
| Range | $55,781 | $38,034 |
| Mean | $37,474 | $45,872 |
| Median | $33,966 | $47,293 |
| Interquartile 25% (IQ1) | $29,676 | $41,079 |
| Interquartile 75% (IQ3) | $44,202 | $51,125 |
| Interquartile Range (IQR) | $14,526 | $10,046 |
| Standard Deviation (Sample) | $11,614 | $7,800 |
| Standard Deviation (Population) | $11,436 | $7,735 |
Similar Demographics by Median Male Earnings
Demographics Similar to Crow by Median Male Earnings
In terms of median male earnings, the demographic groups most similar to Crow are Pima ($42,357, a difference of 0.18%), Menominee ($42,581, a difference of 0.35%), Navajo ($42,098, a difference of 0.80%), Hopi ($42,060, a difference of 0.89%), and Arapaho ($41,758, a difference of 1.6%).
| Demographics | Rating | Rank | Median Male Earnings |
| Natives/Alaskans | 0.0 /100 | #331 | Tragic $44,775 |
| Bahamians | 0.0 /100 | #332 | Tragic $44,756 |
| Immigrants | Congo | 0.0 /100 | #333 | Tragic $44,204 |
| Immigrants | Yemen | 0.0 /100 | #334 | Tragic $44,083 |
| Spanish American Indians | 0.0 /100 | #335 | Tragic $44,010 |
| Immigrants | Cuba | 0.0 /100 | #336 | Tragic $43,461 |
| Menominee | 0.0 /100 | #337 | Tragic $42,581 |
| Crow | 0.0 /100 | #338 | Tragic $42,434 |
| Pima | 0.0 /100 | #339 | Tragic $42,357 |
| Navajo | 0.0 /100 | #340 | Tragic $42,098 |
| Hopi | 0.0 /100 | #341 | Tragic $42,060 |
| Arapaho | 0.0 /100 | #342 | Tragic $41,758 |
| Lumbee | 0.0 /100 | #343 | Tragic $41,715 |
| Pueblo | 0.0 /100 | #344 | Tragic $41,314 |
| Puerto Ricans | 0.0 /100 | #345 | Tragic $40,071 |
Demographics Similar to Immigrants from Liberia by Median Male Earnings
In terms of median male earnings, the demographic groups most similar to Immigrants from Liberia are Belizean ($48,358, a difference of 0.080%), Hmong ($48,254, a difference of 0.13%), Blackfeet ($48,402, a difference of 0.18%), Comanche ($48,202, a difference of 0.24%), and Immigrants from Somalia ($48,439, a difference of 0.25%).
| Demographics | Rating | Rank | Median Male Earnings |
| Cherokee | 0.3 /100 | #271 | Tragic $48,669 |
| Salvadorans | 0.3 /100 | #272 | Tragic $48,646 |
| Jamaicans | 0.3 /100 | #273 | Tragic $48,632 |
| Colville | 0.3 /100 | #274 | Tragic $48,516 |
| Immigrants | Somalia | 0.3 /100 | #275 | Tragic $48,439 |
| Blackfeet | 0.3 /100 | #276 | Tragic $48,402 |
| Belizeans | 0.2 /100 | #277 | Tragic $48,358 |
| Immigrants | Liberia | 0.2 /100 | #278 | Tragic $48,317 |
| Hmong | 0.2 /100 | #279 | Tragic $48,254 |
| Comanche | 0.2 /100 | #280 | Tragic $48,202 |
| Marshallese | 0.2 /100 | #281 | Tragic $48,137 |
| Central Americans | 0.2 /100 | #282 | Tragic $48,093 |
| Immigrants | Jamaica | 0.2 /100 | #283 | Tragic $48,040 |
| Africans | 0.2 /100 | #284 | Tragic $47,994 |
| Paiute | 0.2 /100 | #285 | Tragic $47,991 |