Crow vs Immigrants from Russia Median Male Earnings
COMPARE
Crow
Immigrants from Russia
Median Male Earnings
Median Male Earnings Comparison
Crow
Immigrants from Russia
$42,434
MEDIAN MALE EARNINGS
0.0/ 100
METRIC RATING
338th/ 347
METRIC RANK
$63,326
MEDIAN MALE EARNINGS
100.0/ 100
METRIC RATING
34th/ 347
METRIC RANK
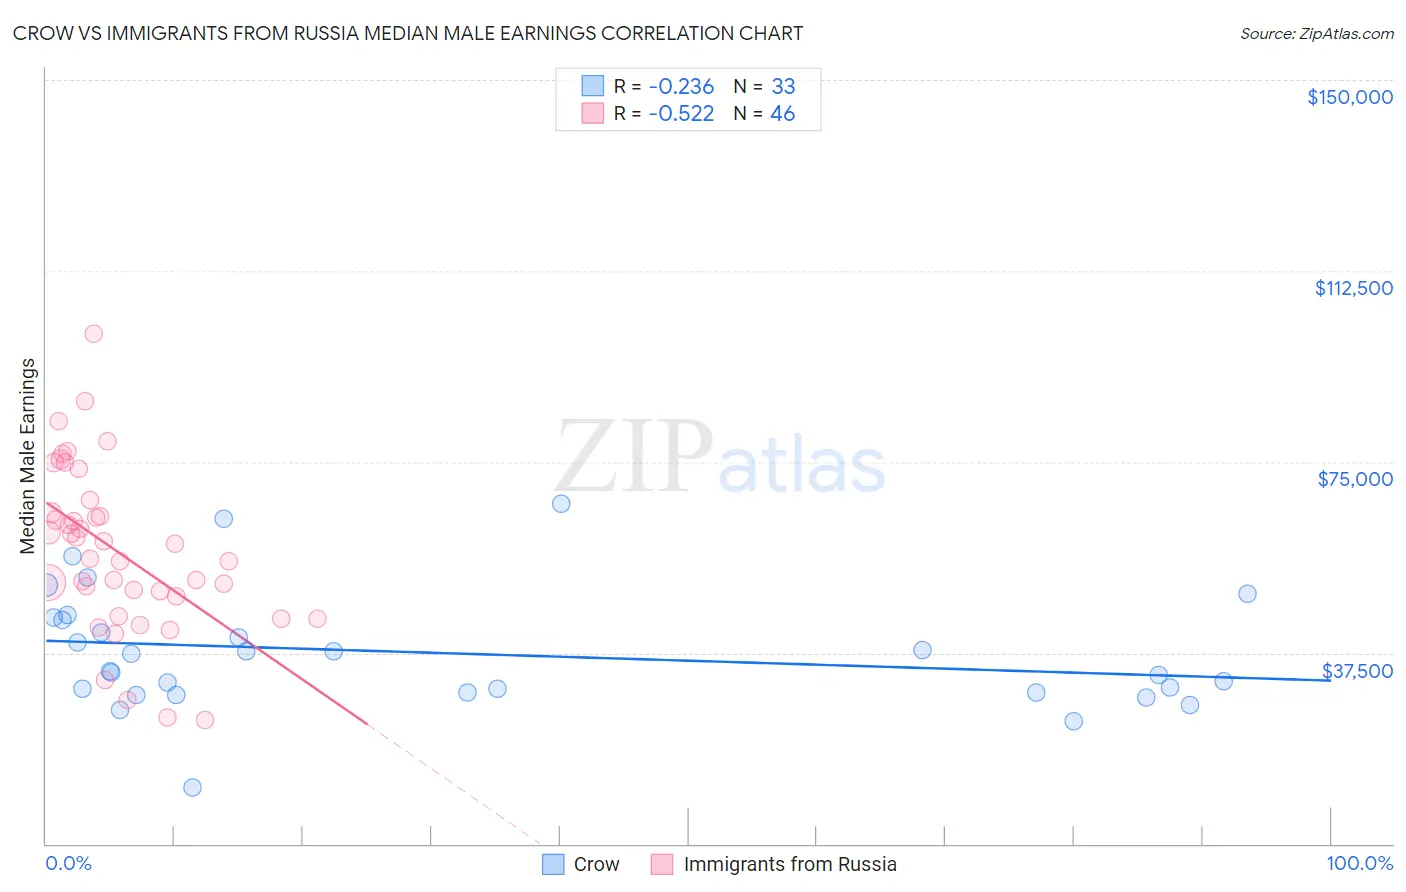
Crow vs Immigrants from Russia Median Male Earnings Correlation Chart
The statistical analysis conducted on geographies consisting of 59,199,884 people shows a weak negative correlation between the proportion of Crow and median male earnings in the United States with a correlation coefficient (R) of -0.236 and weighted average of $42,434. Similarly, the statistical analysis conducted on geographies consisting of 347,872,135 people shows a substantial negative correlation between the proportion of Immigrants from Russia and median male earnings in the United States with a correlation coefficient (R) of -0.522 and weighted average of $63,326, a difference of 49.2%.
Median Male Earnings Correlation Summary
| Measurement | Crow | Immigrants from Russia |
| Minimum | $11,094 | $24,333 |
| Maximum | $66,875 | $100,126 |
| Range | $55,781 | $75,793 |
| Mean | $37,474 | $57,593 |
| Median | $33,966 | $57,441 |
| Interquartile 25% (IQ1) | $29,676 | $48,674 |
| Interquartile 75% (IQ3) | $44,202 | $65,019 |
| Interquartile Range (IQR) | $14,526 | $16,345 |
| Standard Deviation (Sample) | $11,614 | $16,130 |
| Standard Deviation (Population) | $11,436 | $15,954 |
Similar Demographics by Median Male Earnings
Demographics Similar to Crow by Median Male Earnings
In terms of median male earnings, the demographic groups most similar to Crow are Pima ($42,357, a difference of 0.18%), Menominee ($42,581, a difference of 0.35%), Navajo ($42,098, a difference of 0.80%), Hopi ($42,060, a difference of 0.89%), and Arapaho ($41,758, a difference of 1.6%).
| Demographics | Rating | Rank | Median Male Earnings |
| Natives/Alaskans | 0.0 /100 | #331 | Tragic $44,775 |
| Bahamians | 0.0 /100 | #332 | Tragic $44,756 |
| Immigrants | Congo | 0.0 /100 | #333 | Tragic $44,204 |
| Immigrants | Yemen | 0.0 /100 | #334 | Tragic $44,083 |
| Spanish American Indians | 0.0 /100 | #335 | Tragic $44,010 |
| Immigrants | Cuba | 0.0 /100 | #336 | Tragic $43,461 |
| Menominee | 0.0 /100 | #337 | Tragic $42,581 |
| Crow | 0.0 /100 | #338 | Tragic $42,434 |
| Pima | 0.0 /100 | #339 | Tragic $42,357 |
| Navajo | 0.0 /100 | #340 | Tragic $42,098 |
| Hopi | 0.0 /100 | #341 | Tragic $42,060 |
| Arapaho | 0.0 /100 | #342 | Tragic $41,758 |
| Lumbee | 0.0 /100 | #343 | Tragic $41,715 |
| Pueblo | 0.0 /100 | #344 | Tragic $41,314 |
| Puerto Ricans | 0.0 /100 | #345 | Tragic $40,071 |
Demographics Similar to Immigrants from Russia by Median Male Earnings
In terms of median male earnings, the demographic groups most similar to Immigrants from Russia are Immigrants from Lithuania ($63,346, a difference of 0.030%), Soviet Union ($63,382, a difference of 0.090%), Immigrants from Asia ($63,240, a difference of 0.14%), Israeli ($63,228, a difference of 0.16%), and Latvian ($63,498, a difference of 0.27%).
| Demographics | Rating | Rank | Median Male Earnings |
| Immigrants | Switzerland | 100.0 /100 | #27 | Exceptional $63,944 |
| Russians | 100.0 /100 | #28 | Exceptional $63,939 |
| Asians | 100.0 /100 | #29 | Exceptional $63,827 |
| Immigrants | France | 100.0 /100 | #30 | Exceptional $63,715 |
| Latvians | 100.0 /100 | #31 | Exceptional $63,498 |
| Soviet Union | 100.0 /100 | #32 | Exceptional $63,382 |
| Immigrants | Lithuania | 100.0 /100 | #33 | Exceptional $63,346 |
| Immigrants | Russia | 100.0 /100 | #34 | Exceptional $63,326 |
| Immigrants | Asia | 100.0 /100 | #35 | Exceptional $63,240 |
| Israelis | 100.0 /100 | #36 | Exceptional $63,228 |
| Immigrants | Sri Lanka | 100.0 /100 | #37 | Exceptional $63,099 |
| Maltese | 100.0 /100 | #38 | Exceptional $62,953 |
| Immigrants | South Africa | 100.0 /100 | #39 | Exceptional $62,899 |
| Australians | 100.0 /100 | #40 | Exceptional $62,857 |
| Immigrants | Turkey | 100.0 /100 | #41 | Exceptional $62,728 |