Crow vs Colombian Single Father Poverty
COMPARE
Crow
Colombian
Single Father Poverty
Single Father Poverty Comparison
Crow
Colombians
30.3%
SINGLE FATHER POVERTY
0.0/ 100
METRIC RATING
345th/ 347
METRIC RANK
16.1%
SINGLE FATHER POVERTY
77.1/ 100
METRIC RATING
147th/ 347
METRIC RANK
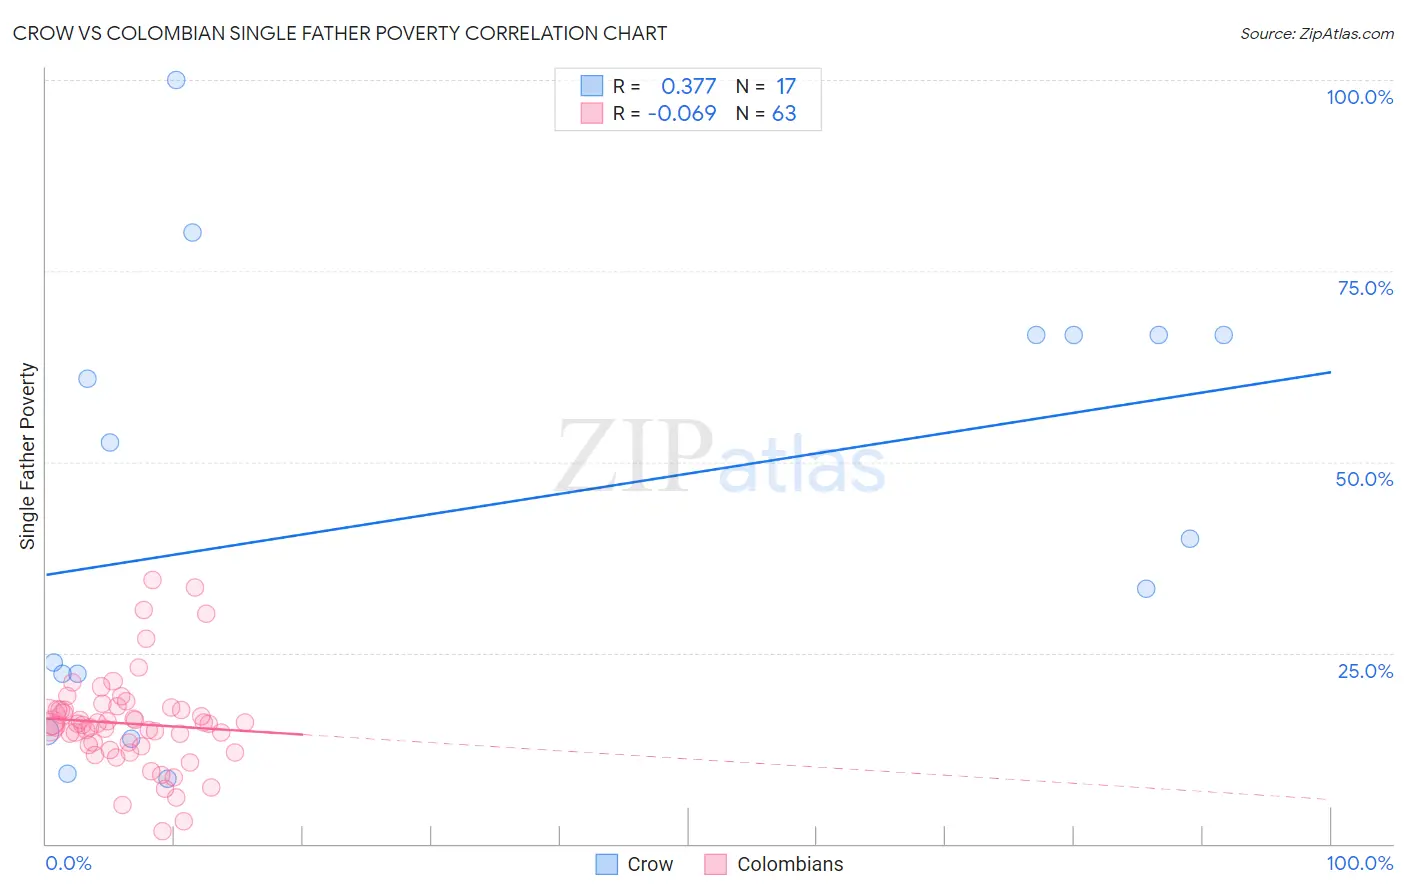
Crow vs Colombian Single Father Poverty Correlation Chart
The statistical analysis conducted on geographies consisting of 55,517,191 people shows a mild positive correlation between the proportion of Crow and poverty level among single fathers in the United States with a correlation coefficient (R) of 0.377 and weighted average of 30.3%. Similarly, the statistical analysis conducted on geographies consisting of 329,050,963 people shows a slight negative correlation between the proportion of Colombians and poverty level among single fathers in the United States with a correlation coefficient (R) of -0.069 and weighted average of 16.1%, a difference of 88.4%.
Single Father Poverty Correlation Summary
| Measurement | Crow | Colombian |
| Minimum | 8.6% | 1.6% |
| Maximum | 100.0% | 34.5% |
| Range | 91.4% | 32.9% |
| Mean | 44.0% | 15.7% |
| Median | 40.0% | 15.6% |
| Interquartile 25% (IQ1) | 18.4% | 12.8% |
| Interquartile 75% (IQ3) | 66.7% | 17.5% |
| Interquartile Range (IQR) | 48.2% | 4.7% |
| Standard Deviation (Sample) | 28.0% | 6.2% |
| Standard Deviation (Population) | 27.2% | 6.2% |
Similar Demographics by Single Father Poverty
Demographics Similar to Crow by Single Father Poverty
In terms of single father poverty, the demographic groups most similar to Crow are Navajo (29.2%, a difference of 3.6%), Puerto Rican (31.5%, a difference of 4.1%), Lumbee (28.5%, a difference of 6.3%), Yuman (28.4%, a difference of 6.7%), and Yup'ik (32.5%, a difference of 7.4%).
| Demographics | Rating | Rank | Single Father Poverty |
| Natives/Alaskans | 0.0 /100 | #333 | Tragic 22.4% |
| Kiowa | 0.0 /100 | #334 | Tragic 22.5% |
| Shoshone | 0.0 /100 | #335 | Tragic 22.9% |
| Cajuns | 0.0 /100 | #336 | Tragic 23.1% |
| Sioux | 0.0 /100 | #337 | Tragic 23.9% |
| Arapaho | 0.0 /100 | #338 | Tragic 24.0% |
| Apache | 0.0 /100 | #339 | Tragic 24.2% |
| Houma | 0.0 /100 | #340 | Tragic 26.7% |
| Hopi | 0.0 /100 | #341 | Tragic 27.2% |
| Yuman | 0.0 /100 | #342 | Tragic 28.4% |
| Lumbee | 0.0 /100 | #343 | Tragic 28.5% |
| Navajo | 0.0 /100 | #344 | Tragic 29.2% |
| Crow | 0.0 /100 | #345 | Tragic 30.3% |
| Puerto Ricans | 0.0 /100 | #346 | Tragic 31.5% |
| Yup'ik | 0.0 /100 | #347 | Tragic 32.5% |
Demographics Similar to Colombians by Single Father Poverty
In terms of single father poverty, the demographic groups most similar to Colombians are Nigerian (16.1%, a difference of 0.020%), Immigrants from Hungary (16.1%, a difference of 0.080%), South African (16.1%, a difference of 0.12%), Jordanian (16.1%, a difference of 0.18%), and Immigrants from Western Asia (16.0%, a difference of 0.24%).
| Demographics | Rating | Rank | Single Father Poverty |
| Immigrants | Netherlands | 85.3 /100 | #140 | Excellent 16.0% |
| Liberians | 83.3 /100 | #141 | Excellent 16.0% |
| Immigrants | Mexico | 83.3 /100 | #142 | Excellent 16.0% |
| Immigrants | Central America | 83.1 /100 | #143 | Excellent 16.0% |
| Immigrants | Kuwait | 81.4 /100 | #144 | Excellent 16.0% |
| Immigrants | Western Asia | 80.7 /100 | #145 | Excellent 16.0% |
| Immigrants | Hungary | 78.3 /100 | #146 | Good 16.1% |
| Colombians | 77.1 /100 | #147 | Good 16.1% |
| Nigerians | 76.8 /100 | #148 | Good 16.1% |
| South Africans | 75.1 /100 | #149 | Good 16.1% |
| Jordanians | 74.2 /100 | #150 | Good 16.1% |
| Immigrants | France | 73.1 /100 | #151 | Good 16.1% |
| Immigrants | Zimbabwe | 72.1 /100 | #152 | Good 16.1% |
| Immigrants | Israel | 72.0 /100 | #153 | Good 16.1% |
| Mexicans | 70.1 /100 | #154 | Good 16.1% |