Immigrants from Colombia vs Colombian Median Male Earnings
COMPARE
Immigrants from Colombia
Colombian
Median Male Earnings
Median Male Earnings Comparison
Immigrants from Colombia
Colombians
$52,725
MEDIAN MALE EARNINGS
15.0/ 100
METRIC RATING
205th/ 347
METRIC RANK
$53,832
MEDIAN MALE EARNINGS
34.4/ 100
METRIC RATING
186th/ 347
METRIC RANK
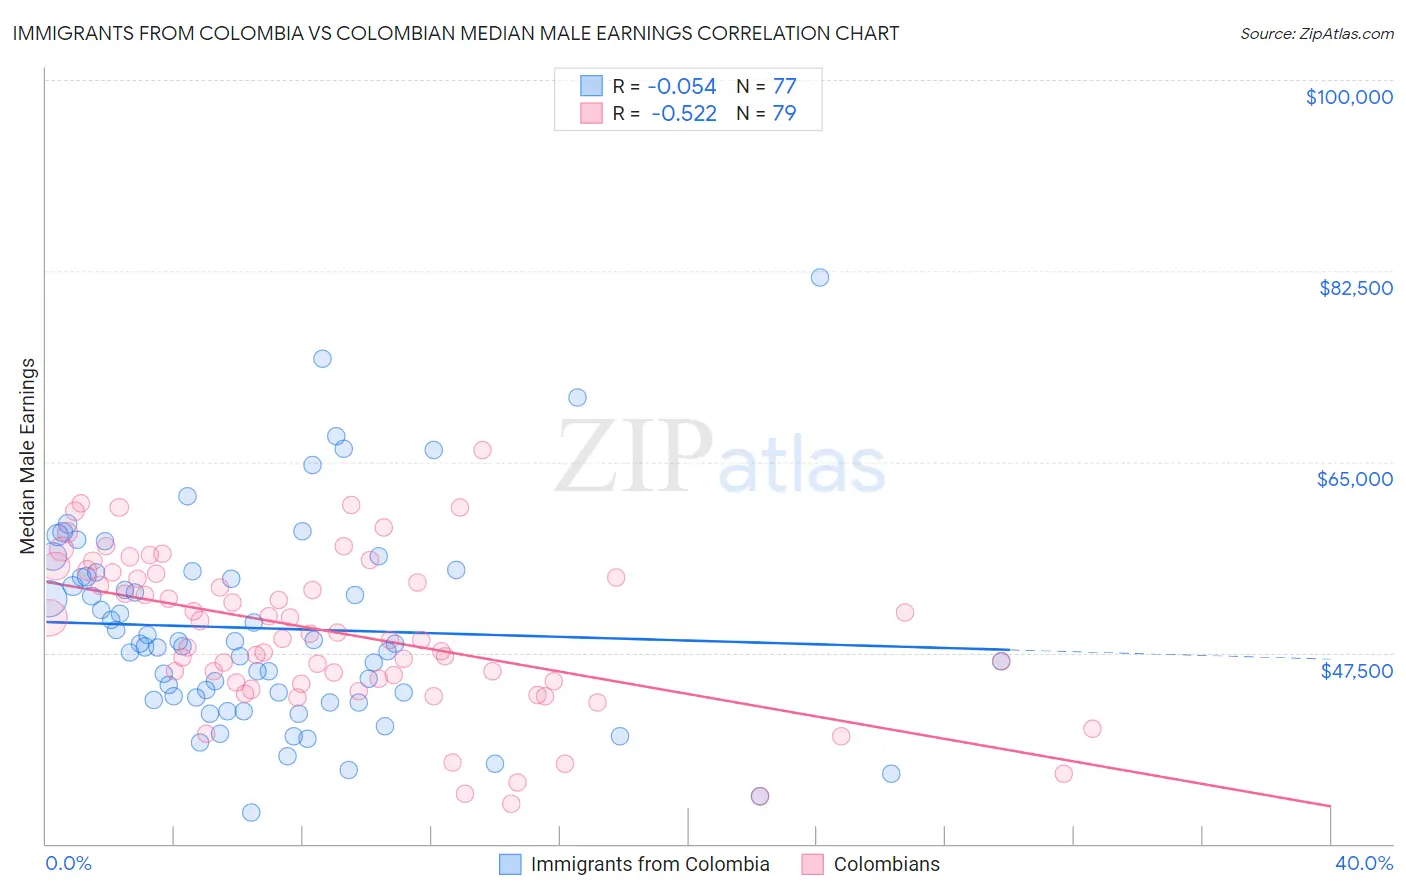
Immigrants from Colombia vs Colombian Median Male Earnings Correlation Chart
The statistical analysis conducted on geographies consisting of 378,593,479 people shows a slight negative correlation between the proportion of Immigrants from Colombia and median male earnings in the United States with a correlation coefficient (R) of -0.054 and weighted average of $52,725. Similarly, the statistical analysis conducted on geographies consisting of 419,486,746 people shows a substantial negative correlation between the proportion of Colombians and median male earnings in the United States with a correlation coefficient (R) of -0.522 and weighted average of $53,832, a difference of 2.1%.
Median Male Earnings Correlation Summary
| Measurement | Immigrants from Colombia | Colombian |
| Minimum | $32,886 | $33,656 |
| Maximum | $81,875 | $66,073 |
| Range | $48,989 | $32,417 |
| Mean | $49,733 | $49,309 |
| Median | $48,323 | $48,805 |
| Interquartile 25% (IQ1) | $43,300 | $44,741 |
| Interquartile 75% (IQ3) | $54,661 | $54,777 |
| Interquartile Range (IQR) | $11,361 | $10,037 |
| Standard Deviation (Sample) | $9,264 | $7,074 |
| Standard Deviation (Population) | $9,204 | $7,029 |
Demographics Similar to Immigrants from Colombia and Colombians by Median Male Earnings
In terms of median male earnings, the demographic groups most similar to Immigrants from Colombia are Ghanaian ($52,810, a difference of 0.16%), Panamanian ($52,835, a difference of 0.21%), Immigrants from Uruguay ($52,860, a difference of 0.26%), Immigrants from Bosnia and Herzegovina ($52,869, a difference of 0.27%), and Immigrants from Thailand ($52,908, a difference of 0.35%). Similarly, the demographic groups most similar to Colombians are Immigrants from Sierra Leone ($53,905, a difference of 0.14%), Immigrants from Eritrea ($53,715, a difference of 0.22%), Immigrants from Eastern Africa ($53,713, a difference of 0.22%), Puget Sound Salish ($53,704, a difference of 0.24%), and Uruguayan ($53,680, a difference of 0.28%).
| Demographics | Rating | Rank | Median Male Earnings |
| Immigrants | Sierra Leone | 36.0 /100 | #185 | Fair $53,905 |
| Colombians | 34.4 /100 | #186 | Fair $53,832 |
| Immigrants | Eritrea | 31.8 /100 | #187 | Fair $53,715 |
| Immigrants | Eastern Africa | 31.8 /100 | #188 | Fair $53,713 |
| Puget Sound Salish | 31.6 /100 | #189 | Fair $53,704 |
| Uruguayans | 31.1 /100 | #190 | Fair $53,680 |
| Guamanians/Chamorros | 30.7 /100 | #191 | Fair $53,661 |
| Scotch-Irish | 30.6 /100 | #192 | Fair $53,658 |
| Kenyans | 30.4 /100 | #193 | Fair $53,647 |
| Spanish | 29.0 /100 | #194 | Fair $53,576 |
| Immigrants | Azores | 27.5 /100 | #195 | Fair $53,503 |
| Immigrants | Africa | 26.6 /100 | #196 | Fair $53,457 |
| Immigrants | Kenya | 26.0 /100 | #197 | Fair $53,427 |
| Immigrants | Costa Rica | 22.6 /100 | #198 | Fair $53,237 |
| Tongans | 22.3 /100 | #199 | Fair $53,218 |
| Immigrants | Thailand | 17.5 /100 | #200 | Poor $52,908 |
| Immigrants | Bosnia and Herzegovina | 16.9 /100 | #201 | Poor $52,869 |
| Immigrants | Uruguay | 16.8 /100 | #202 | Poor $52,860 |
| Panamanians | 16.5 /100 | #203 | Poor $52,835 |
| Ghanaians | 16.1 /100 | #204 | Poor $52,810 |
| Immigrants | Colombia | 15.0 /100 | #205 | Poor $52,725 |