Immigrants from Bolivia vs Colombian Median Male Earnings
COMPARE
Immigrants from Bolivia
Colombian
Median Male Earnings
Median Male Earnings Comparison
Immigrants from Bolivia
Colombians
$60,088
MEDIAN MALE EARNINGS
99.6/ 100
METRIC RATING
75th/ 347
METRIC RANK
$53,832
MEDIAN MALE EARNINGS
34.4/ 100
METRIC RATING
186th/ 347
METRIC RANK
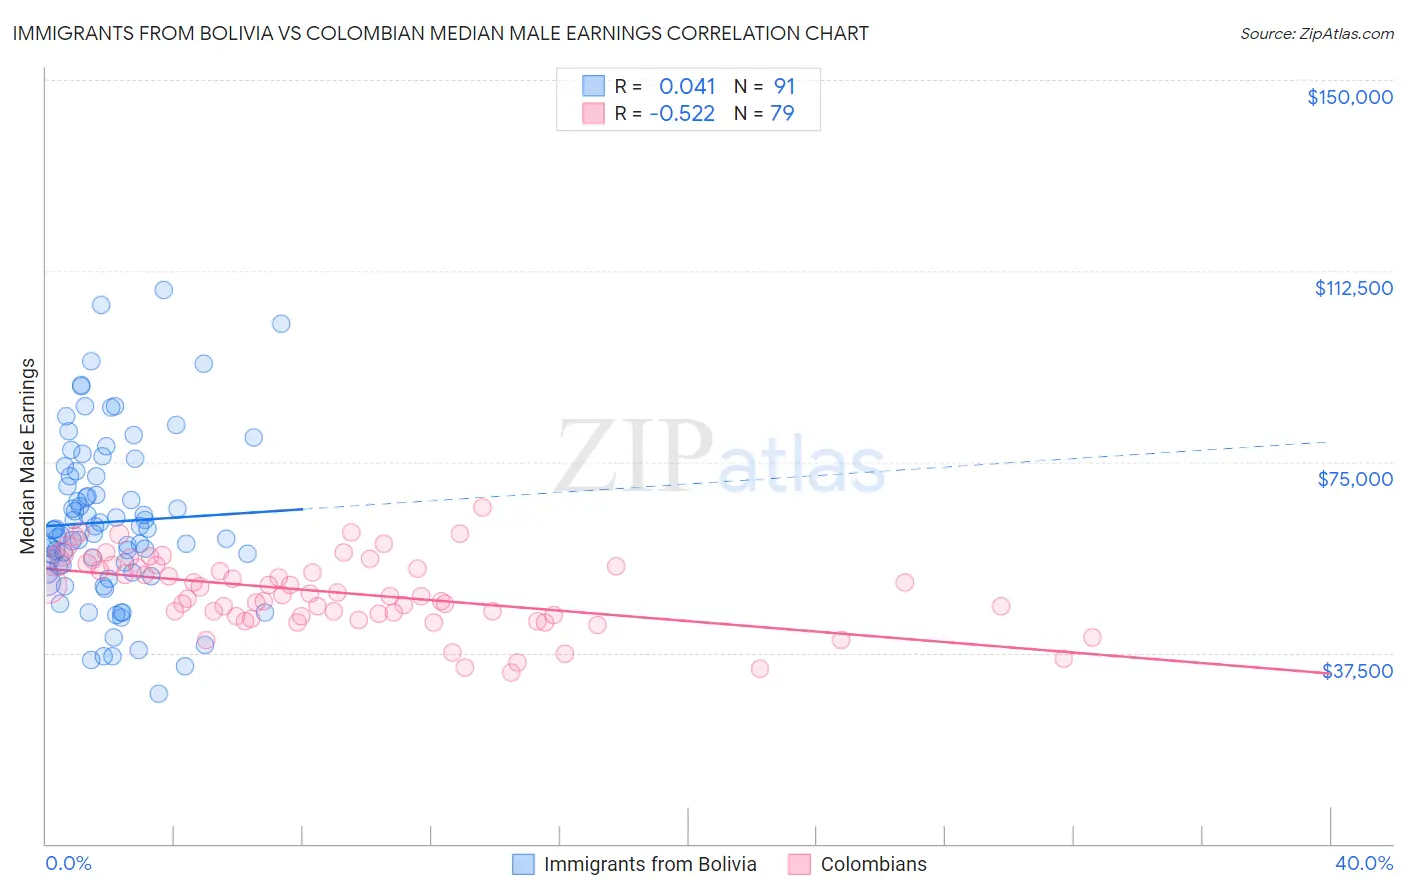
Immigrants from Bolivia vs Colombian Median Male Earnings Correlation Chart
The statistical analysis conducted on geographies consisting of 158,704,796 people shows no correlation between the proportion of Immigrants from Bolivia and median male earnings in the United States with a correlation coefficient (R) of 0.041 and weighted average of $60,088. Similarly, the statistical analysis conducted on geographies consisting of 419,486,746 people shows a substantial negative correlation between the proportion of Colombians and median male earnings in the United States with a correlation coefficient (R) of -0.522 and weighted average of $53,832, a difference of 11.6%.
Median Male Earnings Correlation Summary
| Measurement | Immigrants from Bolivia | Colombian |
| Minimum | $29,412 | $33,656 |
| Maximum | $108,819 | $66,073 |
| Range | $79,407 | $32,417 |
| Mean | $63,204 | $49,309 |
| Median | $61,601 | $48,805 |
| Interquartile 25% (IQ1) | $53,242 | $44,741 |
| Interquartile 75% (IQ3) | $72,136 | $54,777 |
| Interquartile Range (IQR) | $18,895 | $10,037 |
| Standard Deviation (Sample) | $16,071 | $7,074 |
| Standard Deviation (Population) | $15,982 | $7,029 |
Similar Demographics by Median Male Earnings
Demographics Similar to Immigrants from Bolivia by Median Male Earnings
In terms of median male earnings, the demographic groups most similar to Immigrants from Bolivia are Romanian ($60,063, a difference of 0.040%), Argentinean ($60,117, a difference of 0.050%), Paraguayan ($59,975, a difference of 0.19%), Immigrants from Egypt ($59,925, a difference of 0.27%), and Immigrants from North America ($60,265, a difference of 0.29%).
| Demographics | Rating | Rank | Median Male Earnings |
| Immigrants | Serbia | 99.7 /100 | #68 | Exceptional $60,600 |
| Immigrants | Canada | 99.7 /100 | #69 | Exceptional $60,388 |
| Immigrants | Bulgaria | 99.7 /100 | #70 | Exceptional $60,358 |
| Mongolians | 99.7 /100 | #71 | Exceptional $60,350 |
| Immigrants | Western Europe | 99.7 /100 | #72 | Exceptional $60,334 |
| Immigrants | North America | 99.7 /100 | #73 | Exceptional $60,265 |
| Argentineans | 99.6 /100 | #74 | Exceptional $60,117 |
| Immigrants | Bolivia | 99.6 /100 | #75 | Exceptional $60,088 |
| Romanians | 99.6 /100 | #76 | Exceptional $60,063 |
| Paraguayans | 99.5 /100 | #77 | Exceptional $59,975 |
| Immigrants | Egypt | 99.5 /100 | #78 | Exceptional $59,925 |
| Immigrants | Ukraine | 99.5 /100 | #79 | Exceptional $59,820 |
| Immigrants | Hungary | 99.5 /100 | #80 | Exceptional $59,806 |
| Ukrainians | 99.4 /100 | #81 | Exceptional $59,728 |
| Croatians | 99.4 /100 | #82 | Exceptional $59,715 |
Demographics Similar to Colombians by Median Male Earnings
In terms of median male earnings, the demographic groups most similar to Colombians are Immigrants from Sierra Leone ($53,905, a difference of 0.14%), White/Caucasian ($53,925, a difference of 0.17%), Immigrants from Eritrea ($53,715, a difference of 0.22%), Immigrants from Eastern Africa ($53,713, a difference of 0.22%), and Immigrants from South America ($53,962, a difference of 0.24%).
| Demographics | Rating | Rank | Median Male Earnings |
| Celtics | 43.9 /100 | #179 | Average $54,242 |
| Iraqis | 42.5 /100 | #180 | Average $54,182 |
| Immigrants | Immigrants | 42.1 /100 | #181 | Average $54,168 |
| Yugoslavians | 37.4 /100 | #182 | Fair $53,967 |
| Immigrants | South America | 37.3 /100 | #183 | Fair $53,962 |
| Whites/Caucasians | 36.5 /100 | #184 | Fair $53,925 |
| Immigrants | Sierra Leone | 36.0 /100 | #185 | Fair $53,905 |
| Colombians | 34.4 /100 | #186 | Fair $53,832 |
| Immigrants | Eritrea | 31.8 /100 | #187 | Fair $53,715 |
| Immigrants | Eastern Africa | 31.8 /100 | #188 | Fair $53,713 |
| Puget Sound Salish | 31.6 /100 | #189 | Fair $53,704 |
| Uruguayans | 31.1 /100 | #190 | Fair $53,680 |
| Guamanians/Chamorros | 30.7 /100 | #191 | Fair $53,661 |
| Scotch-Irish | 30.6 /100 | #192 | Fair $53,658 |
| Kenyans | 30.4 /100 | #193 | Fair $53,647 |