Crow vs Immigrants from Bolivia Median Male Earnings
COMPARE
Crow
Immigrants from Bolivia
Median Male Earnings
Median Male Earnings Comparison
Crow
Immigrants from Bolivia
$42,434
MEDIAN MALE EARNINGS
0.0/ 100
METRIC RATING
338th/ 347
METRIC RANK
$60,088
MEDIAN MALE EARNINGS
99.6/ 100
METRIC RATING
75th/ 347
METRIC RANK
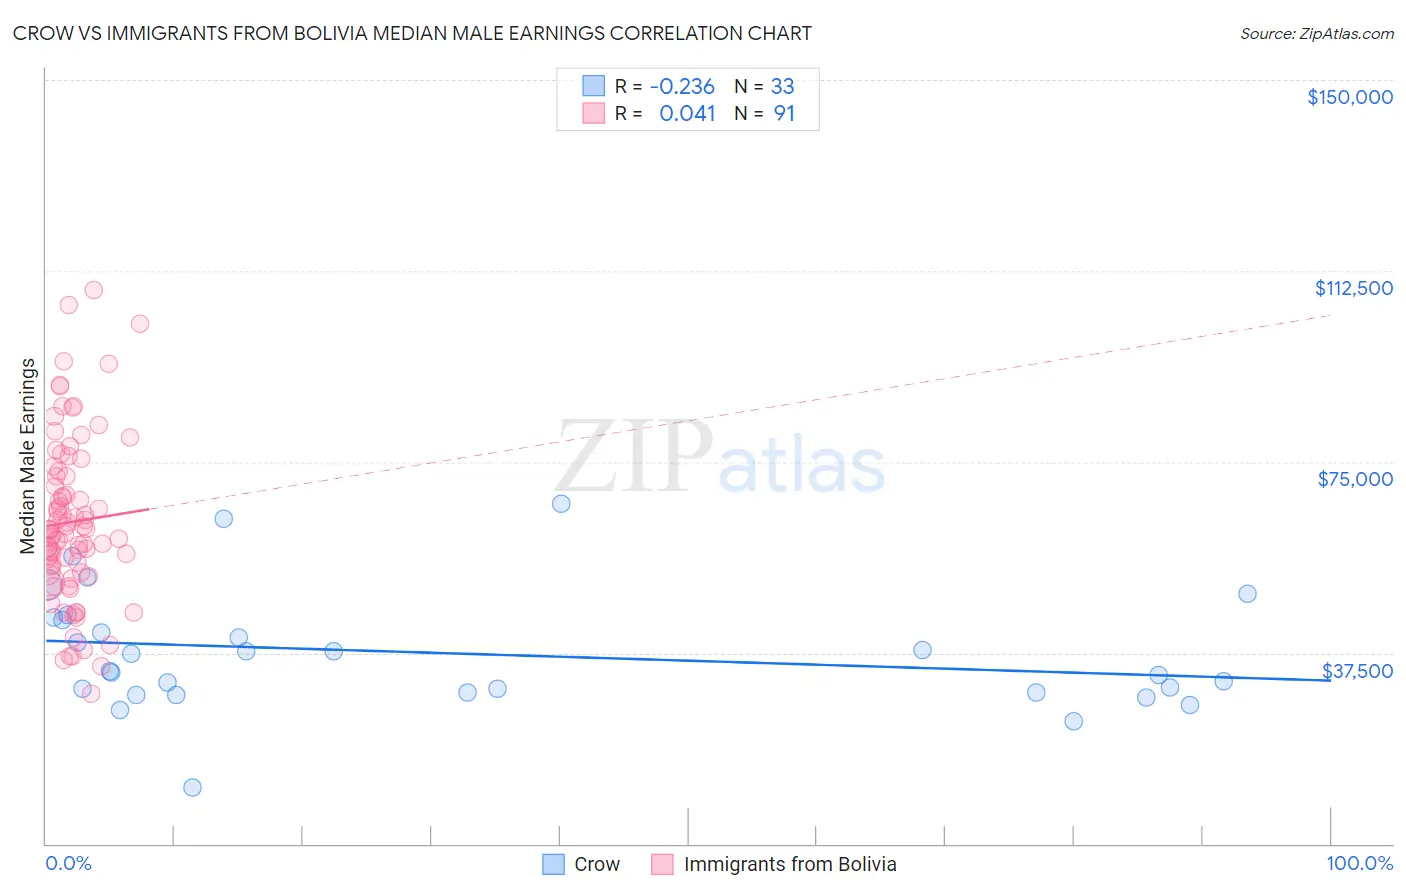
Crow vs Immigrants from Bolivia Median Male Earnings Correlation Chart
The statistical analysis conducted on geographies consisting of 59,199,884 people shows a weak negative correlation between the proportion of Crow and median male earnings in the United States with a correlation coefficient (R) of -0.236 and weighted average of $42,434. Similarly, the statistical analysis conducted on geographies consisting of 158,704,796 people shows no correlation between the proportion of Immigrants from Bolivia and median male earnings in the United States with a correlation coefficient (R) of 0.041 and weighted average of $60,088, a difference of 41.6%.
Median Male Earnings Correlation Summary
| Measurement | Crow | Immigrants from Bolivia |
| Minimum | $11,094 | $29,412 |
| Maximum | $66,875 | $108,819 |
| Range | $55,781 | $79,407 |
| Mean | $37,474 | $63,204 |
| Median | $33,966 | $61,601 |
| Interquartile 25% (IQ1) | $29,676 | $53,242 |
| Interquartile 75% (IQ3) | $44,202 | $72,136 |
| Interquartile Range (IQR) | $14,526 | $18,895 |
| Standard Deviation (Sample) | $11,614 | $16,071 |
| Standard Deviation (Population) | $11,436 | $15,982 |
Similar Demographics by Median Male Earnings
Demographics Similar to Crow by Median Male Earnings
In terms of median male earnings, the demographic groups most similar to Crow are Pima ($42,357, a difference of 0.18%), Menominee ($42,581, a difference of 0.35%), Navajo ($42,098, a difference of 0.80%), Hopi ($42,060, a difference of 0.89%), and Arapaho ($41,758, a difference of 1.6%).
| Demographics | Rating | Rank | Median Male Earnings |
| Natives/Alaskans | 0.0 /100 | #331 | Tragic $44,775 |
| Bahamians | 0.0 /100 | #332 | Tragic $44,756 |
| Immigrants | Congo | 0.0 /100 | #333 | Tragic $44,204 |
| Immigrants | Yemen | 0.0 /100 | #334 | Tragic $44,083 |
| Spanish American Indians | 0.0 /100 | #335 | Tragic $44,010 |
| Immigrants | Cuba | 0.0 /100 | #336 | Tragic $43,461 |
| Menominee | 0.0 /100 | #337 | Tragic $42,581 |
| Crow | 0.0 /100 | #338 | Tragic $42,434 |
| Pima | 0.0 /100 | #339 | Tragic $42,357 |
| Navajo | 0.0 /100 | #340 | Tragic $42,098 |
| Hopi | 0.0 /100 | #341 | Tragic $42,060 |
| Arapaho | 0.0 /100 | #342 | Tragic $41,758 |
| Lumbee | 0.0 /100 | #343 | Tragic $41,715 |
| Pueblo | 0.0 /100 | #344 | Tragic $41,314 |
| Puerto Ricans | 0.0 /100 | #345 | Tragic $40,071 |
Demographics Similar to Immigrants from Bolivia by Median Male Earnings
In terms of median male earnings, the demographic groups most similar to Immigrants from Bolivia are Romanian ($60,063, a difference of 0.040%), Argentinean ($60,117, a difference of 0.050%), Paraguayan ($59,975, a difference of 0.19%), Immigrants from Egypt ($59,925, a difference of 0.27%), and Immigrants from North America ($60,265, a difference of 0.29%).
| Demographics | Rating | Rank | Median Male Earnings |
| Immigrants | Serbia | 99.7 /100 | #68 | Exceptional $60,600 |
| Immigrants | Canada | 99.7 /100 | #69 | Exceptional $60,388 |
| Immigrants | Bulgaria | 99.7 /100 | #70 | Exceptional $60,358 |
| Mongolians | 99.7 /100 | #71 | Exceptional $60,350 |
| Immigrants | Western Europe | 99.7 /100 | #72 | Exceptional $60,334 |
| Immigrants | North America | 99.7 /100 | #73 | Exceptional $60,265 |
| Argentineans | 99.6 /100 | #74 | Exceptional $60,117 |
| Immigrants | Bolivia | 99.6 /100 | #75 | Exceptional $60,088 |
| Romanians | 99.6 /100 | #76 | Exceptional $60,063 |
| Paraguayans | 99.5 /100 | #77 | Exceptional $59,975 |
| Immigrants | Egypt | 99.5 /100 | #78 | Exceptional $59,925 |
| Immigrants | Ukraine | 99.5 /100 | #79 | Exceptional $59,820 |
| Immigrants | Hungary | 99.5 /100 | #80 | Exceptional $59,806 |
| Ukrainians | 99.4 /100 | #81 | Exceptional $59,728 |
| Croatians | 99.4 /100 | #82 | Exceptional $59,715 |