Crow vs Lumbee Median Male Earnings
COMPARE
Crow
Lumbee
Median Male Earnings
Median Male Earnings Comparison
Crow
Lumbee
$42,434
MEDIAN MALE EARNINGS
0.0/ 100
METRIC RATING
338th/ 347
METRIC RANK
$41,715
MEDIAN MALE EARNINGS
0.0/ 100
METRIC RATING
343rd/ 347
METRIC RANK
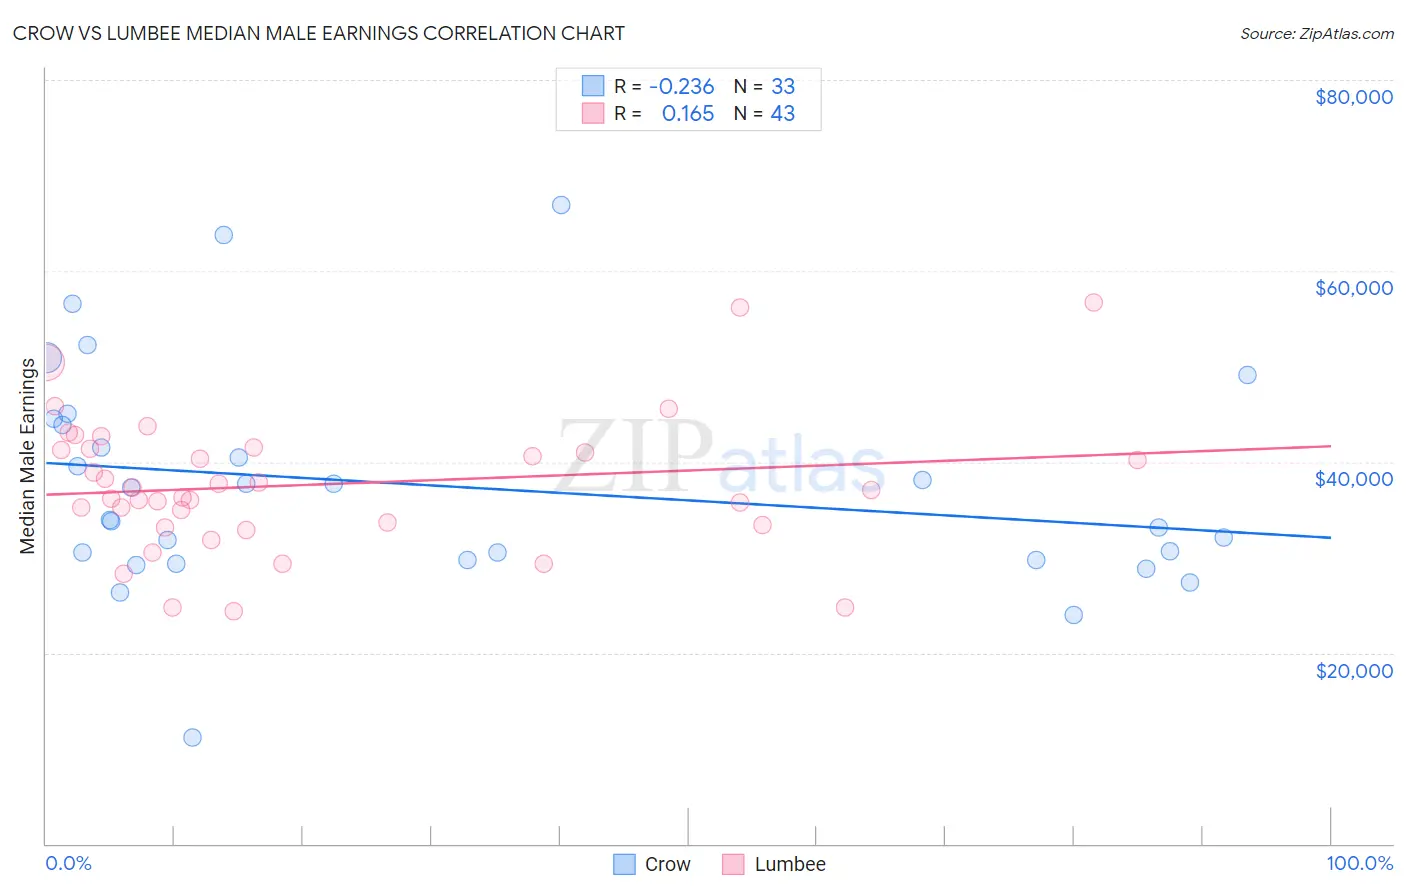
Crow vs Lumbee Median Male Earnings Correlation Chart
The statistical analysis conducted on geographies consisting of 59,199,884 people shows a weak negative correlation between the proportion of Crow and median male earnings in the United States with a correlation coefficient (R) of -0.236 and weighted average of $42,434. Similarly, the statistical analysis conducted on geographies consisting of 92,276,202 people shows a poor positive correlation between the proportion of Lumbee and median male earnings in the United States with a correlation coefficient (R) of 0.165 and weighted average of $41,715, a difference of 1.7%.
Median Male Earnings Correlation Summary
| Measurement | Crow | Lumbee |
| Minimum | $11,094 | $24,297 |
| Maximum | $66,875 | $56,719 |
| Range | $55,781 | $32,422 |
| Mean | $37,474 | $37,623 |
| Median | $33,966 | $37,072 |
| Interquartile 25% (IQ1) | $29,676 | $33,323 |
| Interquartile 75% (IQ3) | $44,202 | $41,323 |
| Interquartile Range (IQR) | $14,526 | $8,000 |
| Standard Deviation (Sample) | $11,614 | $7,117 |
| Standard Deviation (Population) | $11,436 | $7,034 |
Demographics Similar to Crow and Lumbee by Median Male Earnings
In terms of median male earnings, the demographic groups most similar to Crow are Pima ($42,357, a difference of 0.18%), Menominee ($42,581, a difference of 0.35%), Navajo ($42,098, a difference of 0.80%), Hopi ($42,060, a difference of 0.89%), and Arapaho ($41,758, a difference of 1.6%). Similarly, the demographic groups most similar to Lumbee are Arapaho ($41,758, a difference of 0.10%), Hopi ($42,060, a difference of 0.83%), Navajo ($42,098, a difference of 0.92%), Pueblo ($41,314, a difference of 0.97%), and Pima ($42,357, a difference of 1.5%).
| Demographics | Rating | Rank | Median Male Earnings |
| Kiowa | 0.0 /100 | #328 | Tragic $45,094 |
| Yakama | 0.0 /100 | #329 | Tragic $45,002 |
| Immigrants | Mexico | 0.0 /100 | #330 | Tragic $44,960 |
| Natives/Alaskans | 0.0 /100 | #331 | Tragic $44,775 |
| Bahamians | 0.0 /100 | #332 | Tragic $44,756 |
| Immigrants | Congo | 0.0 /100 | #333 | Tragic $44,204 |
| Immigrants | Yemen | 0.0 /100 | #334 | Tragic $44,083 |
| Spanish American Indians | 0.0 /100 | #335 | Tragic $44,010 |
| Immigrants | Cuba | 0.0 /100 | #336 | Tragic $43,461 |
| Menominee | 0.0 /100 | #337 | Tragic $42,581 |
| Crow | 0.0 /100 | #338 | Tragic $42,434 |
| Pima | 0.0 /100 | #339 | Tragic $42,357 |
| Navajo | 0.0 /100 | #340 | Tragic $42,098 |
| Hopi | 0.0 /100 | #341 | Tragic $42,060 |
| Arapaho | 0.0 /100 | #342 | Tragic $41,758 |
| Lumbee | 0.0 /100 | #343 | Tragic $41,715 |
| Pueblo | 0.0 /100 | #344 | Tragic $41,314 |
| Puerto Ricans | 0.0 /100 | #345 | Tragic $40,071 |
| Tohono O'odham | 0.0 /100 | #346 | Tragic $39,543 |
| Yup'ik | 0.0 /100 | #347 | Tragic $39,504 |