Crow vs Lithuanian Median Male Earnings
COMPARE
Crow
Lithuanian
Median Male Earnings
Median Male Earnings Comparison
Crow
Lithuanians
$42,434
MEDIAN MALE EARNINGS
0.0/ 100
METRIC RATING
338th/ 347
METRIC RANK
$61,228
MEDIAN MALE EARNINGS
99.9/ 100
METRIC RATING
56th/ 347
METRIC RANK
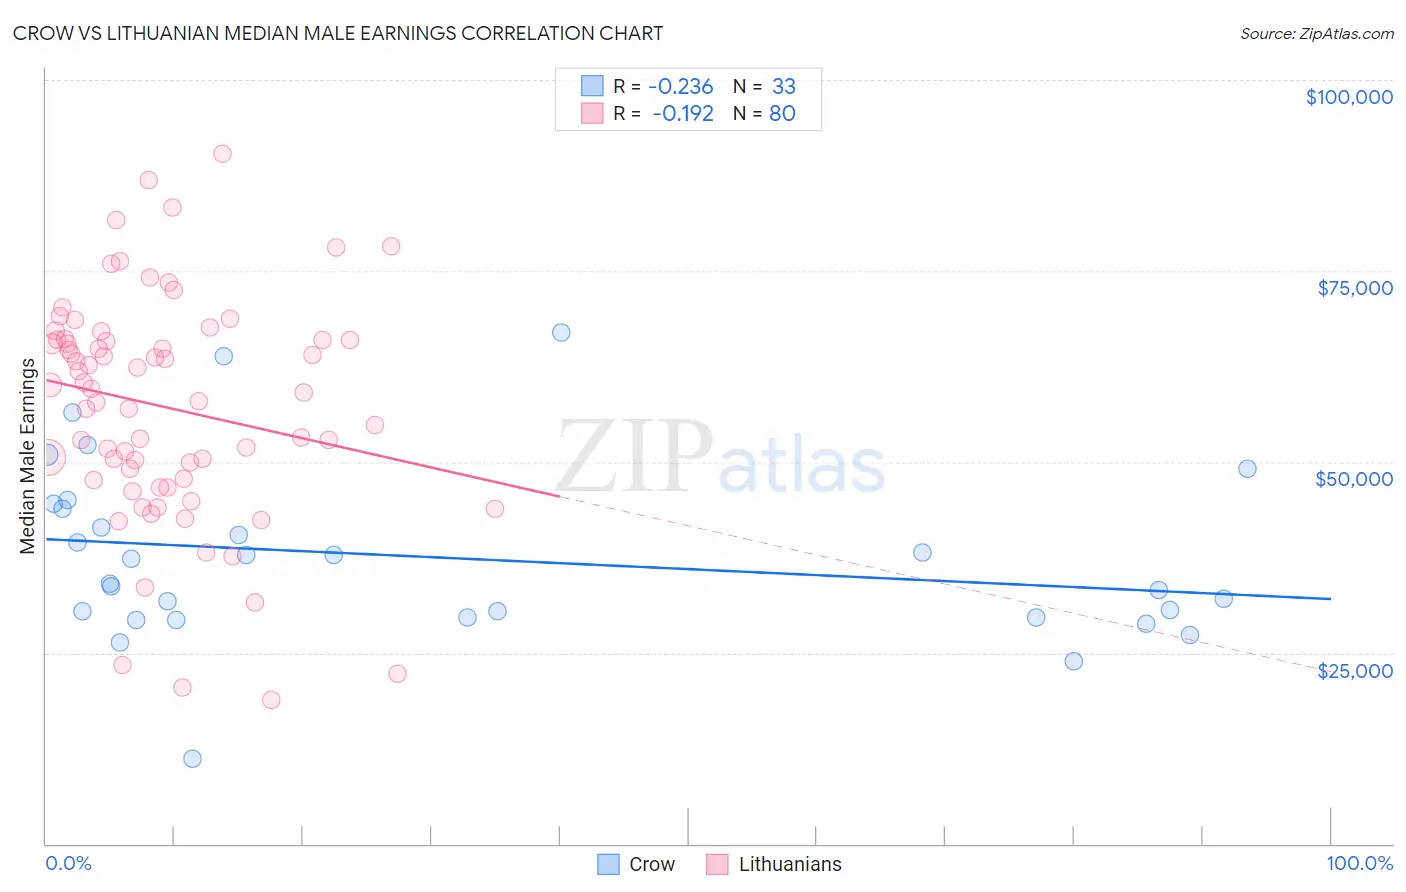
Crow vs Lithuanian Median Male Earnings Correlation Chart
The statistical analysis conducted on geographies consisting of 59,199,884 people shows a weak negative correlation between the proportion of Crow and median male earnings in the United States with a correlation coefficient (R) of -0.236 and weighted average of $42,434. Similarly, the statistical analysis conducted on geographies consisting of 421,749,133 people shows a poor negative correlation between the proportion of Lithuanians and median male earnings in the United States with a correlation coefficient (R) of -0.192 and weighted average of $61,228, a difference of 44.3%.
Median Male Earnings Correlation Summary
| Measurement | Crow | Lithuanian |
| Minimum | $11,094 | $18,839 |
| Maximum | $66,875 | $90,313 |
| Range | $55,781 | $71,474 |
| Mean | $37,474 | $57,160 |
| Median | $33,966 | $59,359 |
| Interquartile 25% (IQ1) | $29,676 | $47,714 |
| Interquartile 75% (IQ3) | $44,202 | $66,000 |
| Interquartile Range (IQR) | $14,526 | $18,286 |
| Standard Deviation (Sample) | $11,614 | $14,769 |
| Standard Deviation (Population) | $11,436 | $14,676 |
Similar Demographics by Median Male Earnings
Demographics Similar to Crow by Median Male Earnings
In terms of median male earnings, the demographic groups most similar to Crow are Pima ($42,357, a difference of 0.18%), Menominee ($42,581, a difference of 0.35%), Navajo ($42,098, a difference of 0.80%), Hopi ($42,060, a difference of 0.89%), and Arapaho ($41,758, a difference of 1.6%).
| Demographics | Rating | Rank | Median Male Earnings |
| Natives/Alaskans | 0.0 /100 | #331 | Tragic $44,775 |
| Bahamians | 0.0 /100 | #332 | Tragic $44,756 |
| Immigrants | Congo | 0.0 /100 | #333 | Tragic $44,204 |
| Immigrants | Yemen | 0.0 /100 | #334 | Tragic $44,083 |
| Spanish American Indians | 0.0 /100 | #335 | Tragic $44,010 |
| Immigrants | Cuba | 0.0 /100 | #336 | Tragic $43,461 |
| Menominee | 0.0 /100 | #337 | Tragic $42,581 |
| Crow | 0.0 /100 | #338 | Tragic $42,434 |
| Pima | 0.0 /100 | #339 | Tragic $42,357 |
| Navajo | 0.0 /100 | #340 | Tragic $42,098 |
| Hopi | 0.0 /100 | #341 | Tragic $42,060 |
| Arapaho | 0.0 /100 | #342 | Tragic $41,758 |
| Lumbee | 0.0 /100 | #343 | Tragic $41,715 |
| Pueblo | 0.0 /100 | #344 | Tragic $41,314 |
| Puerto Ricans | 0.0 /100 | #345 | Tragic $40,071 |
Demographics Similar to Lithuanians by Median Male Earnings
In terms of median male earnings, the demographic groups most similar to Lithuanians are Immigrants from Scotland ($61,220, a difference of 0.010%), Greek ($61,242, a difference of 0.020%), New Zealander ($61,199, a difference of 0.050%), Immigrants from Netherlands ($61,096, a difference of 0.22%), and Egyptian ($61,095, a difference of 0.22%).
| Demographics | Rating | Rank | Median Male Earnings |
| Immigrants | Europe | 99.9 /100 | #49 | Exceptional $62,057 |
| Bhutanese | 99.9 /100 | #50 | Exceptional $61,759 |
| Estonians | 99.9 /100 | #51 | Exceptional $61,710 |
| Immigrants | Norway | 99.9 /100 | #52 | Exceptional $61,628 |
| South Africans | 99.9 /100 | #53 | Exceptional $61,460 |
| Immigrants | Latvia | 99.9 /100 | #54 | Exceptional $61,422 |
| Greeks | 99.9 /100 | #55 | Exceptional $61,242 |
| Lithuanians | 99.9 /100 | #56 | Exceptional $61,228 |
| Immigrants | Scotland | 99.9 /100 | #57 | Exceptional $61,220 |
| New Zealanders | 99.9 /100 | #58 | Exceptional $61,199 |
| Immigrants | Netherlands | 99.8 /100 | #59 | Exceptional $61,096 |
| Egyptians | 99.8 /100 | #60 | Exceptional $61,095 |
| Bolivians | 99.8 /100 | #61 | Exceptional $61,066 |
| Immigrants | Romania | 99.8 /100 | #62 | Exceptional $61,040 |
| Immigrants | Pakistan | 99.8 /100 | #63 | Exceptional $60,987 |