Croatian vs Immigrants from Denmark Per Capita Income
COMPARE
Croatian
Immigrants from Denmark
Per Capita Income
Per Capita Income Comparison
Croatians
Immigrants from Denmark
$47,742
PER CAPITA INCOME
99.0/ 100
METRIC RATING
88th/ 347
METRIC RANK
$53,799
PER CAPITA INCOME
100.0/ 100
METRIC RATING
24th/ 347
METRIC RANK
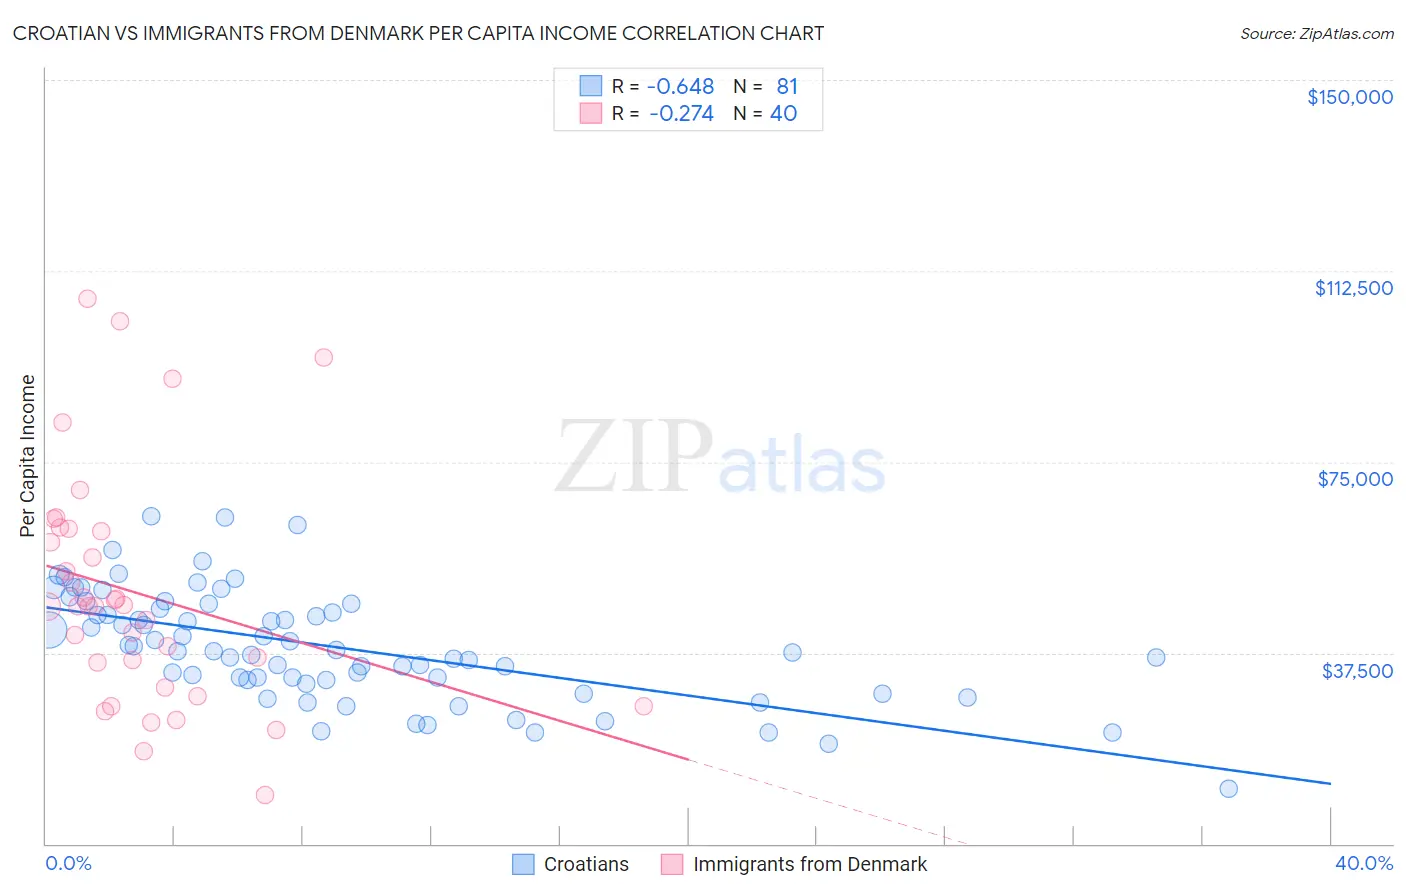
Croatian vs Immigrants from Denmark Per Capita Income Correlation Chart
The statistical analysis conducted on geographies consisting of 375,755,176 people shows a significant negative correlation between the proportion of Croatians and per capita income in the United States with a correlation coefficient (R) of -0.648 and weighted average of $47,742. Similarly, the statistical analysis conducted on geographies consisting of 136,433,467 people shows a weak negative correlation between the proportion of Immigrants from Denmark and per capita income in the United States with a correlation coefficient (R) of -0.274 and weighted average of $53,799, a difference of 12.7%.
Per Capita Income Correlation Summary
| Measurement | Croatian | Immigrants from Denmark |
| Minimum | $10,765 | $9,511 |
| Maximum | $64,427 | $106,981 |
| Range | $53,662 | $97,470 |
| Mean | $38,757 | $49,281 |
| Median | $37,830 | $46,658 |
| Interquartile 25% (IQ1) | $32,092 | $33,062 |
| Interquartile 75% (IQ3) | $46,598 | $61,546 |
| Interquartile Range (IQR) | $14,505 | $28,484 |
| Standard Deviation (Sample) | $10,847 | $22,845 |
| Standard Deviation (Population) | $10,780 | $22,558 |
Similar Demographics by Per Capita Income
Demographics Similar to Croatians by Per Capita Income
In terms of per capita income, the demographic groups most similar to Croatians are Northern European ($47,698, a difference of 0.090%), Italian ($47,574, a difference of 0.35%), Macedonian ($47,573, a difference of 0.36%), Immigrants from Moldova ($47,489, a difference of 0.53%), and Ukrainian ($48,014, a difference of 0.57%).
| Demographics | Rating | Rank | Per Capita Income |
| Armenians | 99.4 /100 | #81 | Exceptional $48,287 |
| Immigrants | Indonesia | 99.4 /100 | #82 | Exceptional $48,195 |
| Immigrants | Brazil | 99.4 /100 | #83 | Exceptional $48,164 |
| Immigrants | Ukraine | 99.3 /100 | #84 | Exceptional $48,134 |
| Austrians | 99.3 /100 | #85 | Exceptional $48,116 |
| Immigrants | Southern Europe | 99.3 /100 | #86 | Exceptional $48,027 |
| Ukrainians | 99.3 /100 | #87 | Exceptional $48,014 |
| Croatians | 99.0 /100 | #88 | Exceptional $47,742 |
| Northern Europeans | 98.9 /100 | #89 | Exceptional $47,698 |
| Italians | 98.8 /100 | #90 | Exceptional $47,574 |
| Macedonians | 98.8 /100 | #91 | Exceptional $47,573 |
| Immigrants | Moldova | 98.7 /100 | #92 | Exceptional $47,489 |
| Immigrants | Zimbabwe | 98.5 /100 | #93 | Exceptional $47,394 |
| Albanians | 98.5 /100 | #94 | Exceptional $47,379 |
| Immigrants | Egypt | 98.5 /100 | #95 | Exceptional $47,361 |
Demographics Similar to Immigrants from Denmark by Per Capita Income
In terms of per capita income, the demographic groups most similar to Immigrants from Denmark are Immigrants from Eastern Asia ($53,806, a difference of 0.010%), Indian (Asian) ($53,874, a difference of 0.14%), Immigrants from Northern Europe ($54,159, a difference of 0.67%), Soviet Union ($54,202, a difference of 0.75%), and Immigrants from Japan ($53,359, a difference of 0.82%).
| Demographics | Rating | Rank | Per Capita Income |
| Immigrants | France | 100.0 /100 | #17 | Exceptional $54,557 |
| Thais | 100.0 /100 | #18 | Exceptional $54,307 |
| Immigrants | China | 100.0 /100 | #19 | Exceptional $54,264 |
| Soviet Union | 100.0 /100 | #20 | Exceptional $54,202 |
| Immigrants | Northern Europe | 100.0 /100 | #21 | Exceptional $54,159 |
| Indians (Asian) | 100.0 /100 | #22 | Exceptional $53,874 |
| Immigrants | Eastern Asia | 100.0 /100 | #23 | Exceptional $53,806 |
| Immigrants | Denmark | 100.0 /100 | #24 | Exceptional $53,799 |
| Immigrants | Japan | 100.0 /100 | #25 | Exceptional $53,359 |
| Russians | 100.0 /100 | #26 | Exceptional $53,154 |
| Immigrants | South Central Asia | 100.0 /100 | #27 | Exceptional $52,660 |
| Latvians | 100.0 /100 | #28 | Exceptional $52,649 |
| Israelis | 100.0 /100 | #29 | Exceptional $52,596 |
| Immigrants | Austria | 100.0 /100 | #30 | Exceptional $52,503 |
| Turks | 100.0 /100 | #31 | Exceptional $52,391 |