Croatian vs Immigrants from Israel Per Capita Income
COMPARE
Croatian
Immigrants from Israel
Per Capita Income
Per Capita Income Comparison
Croatians
Immigrants from Israel
$47,742
PER CAPITA INCOME
99.0/ 100
METRIC RATING
88th/ 347
METRIC RANK
$57,384
PER CAPITA INCOME
100.0/ 100
METRIC RATING
7th/ 347
METRIC RANK
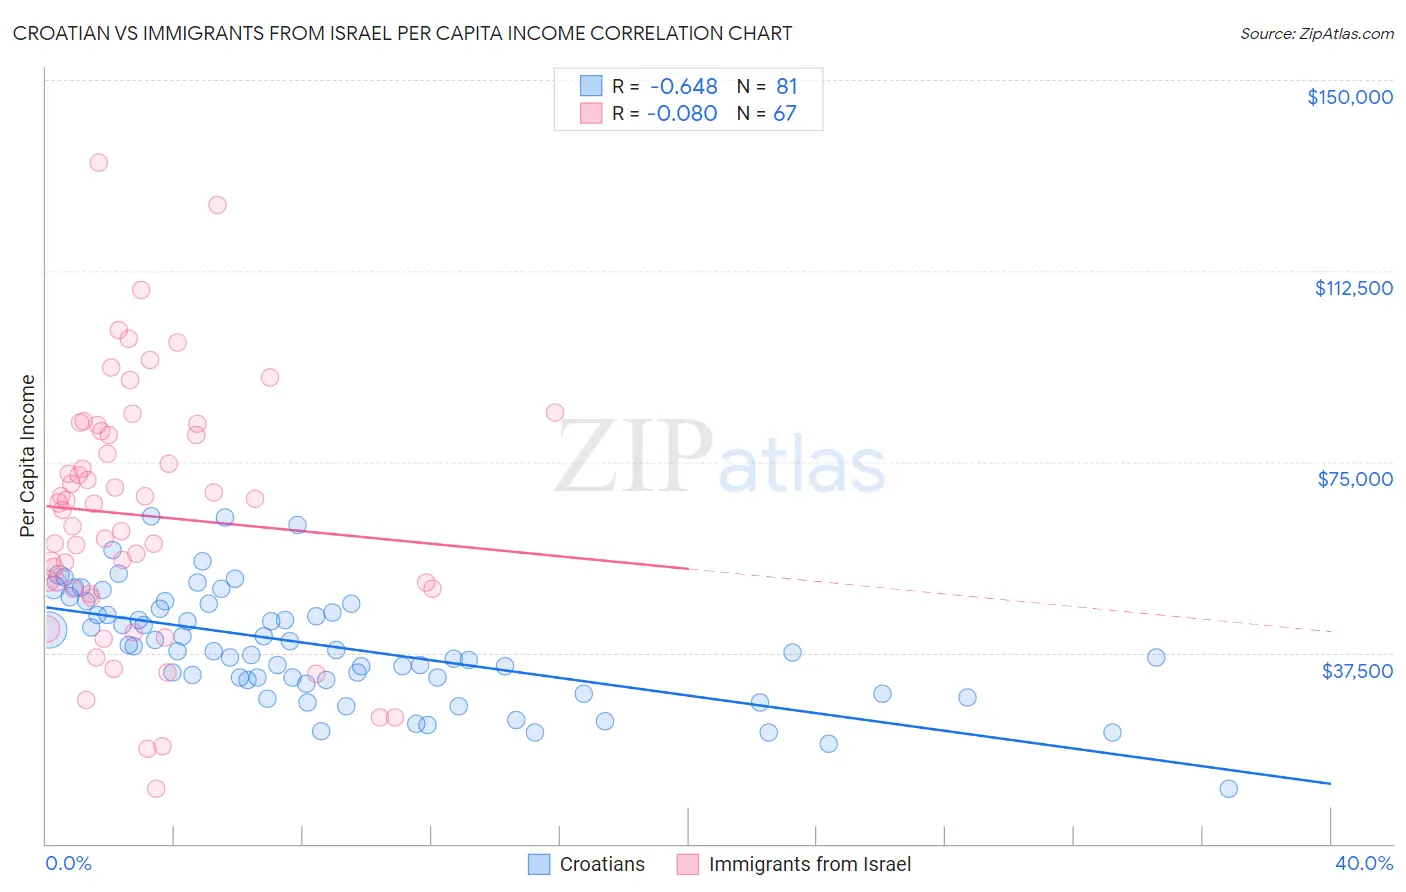
Croatian vs Immigrants from Israel Per Capita Income Correlation Chart
The statistical analysis conducted on geographies consisting of 375,755,176 people shows a significant negative correlation between the proportion of Croatians and per capita income in the United States with a correlation coefficient (R) of -0.648 and weighted average of $47,742. Similarly, the statistical analysis conducted on geographies consisting of 210,034,998 people shows a slight negative correlation between the proportion of Immigrants from Israel and per capita income in the United States with a correlation coefficient (R) of -0.080 and weighted average of $57,384, a difference of 20.2%.
Per Capita Income Correlation Summary
| Measurement | Croatian | Immigrants from Israel |
| Minimum | $10,765 | $10,922 |
| Maximum | $64,427 | $133,703 |
| Range | $53,662 | $122,781 |
| Mean | $38,757 | $64,480 |
| Median | $37,830 | $66,721 |
| Interquartile 25% (IQ1) | $32,092 | $50,016 |
| Interquartile 75% (IQ3) | $46,598 | $80,903 |
| Interquartile Range (IQR) | $14,505 | $30,888 |
| Standard Deviation (Sample) | $10,847 | $24,657 |
| Standard Deviation (Population) | $10,780 | $24,473 |
Similar Demographics by Per Capita Income
Demographics Similar to Croatians by Per Capita Income
In terms of per capita income, the demographic groups most similar to Croatians are Northern European ($47,698, a difference of 0.090%), Italian ($47,574, a difference of 0.35%), Macedonian ($47,573, a difference of 0.36%), Immigrants from Moldova ($47,489, a difference of 0.53%), and Ukrainian ($48,014, a difference of 0.57%).
| Demographics | Rating | Rank | Per Capita Income |
| Armenians | 99.4 /100 | #81 | Exceptional $48,287 |
| Immigrants | Indonesia | 99.4 /100 | #82 | Exceptional $48,195 |
| Immigrants | Brazil | 99.4 /100 | #83 | Exceptional $48,164 |
| Immigrants | Ukraine | 99.3 /100 | #84 | Exceptional $48,134 |
| Austrians | 99.3 /100 | #85 | Exceptional $48,116 |
| Immigrants | Southern Europe | 99.3 /100 | #86 | Exceptional $48,027 |
| Ukrainians | 99.3 /100 | #87 | Exceptional $48,014 |
| Croatians | 99.0 /100 | #88 | Exceptional $47,742 |
| Northern Europeans | 98.9 /100 | #89 | Exceptional $47,698 |
| Italians | 98.8 /100 | #90 | Exceptional $47,574 |
| Macedonians | 98.8 /100 | #91 | Exceptional $47,573 |
| Immigrants | Moldova | 98.7 /100 | #92 | Exceptional $47,489 |
| Immigrants | Zimbabwe | 98.5 /100 | #93 | Exceptional $47,394 |
| Albanians | 98.5 /100 | #94 | Exceptional $47,379 |
| Immigrants | Egypt | 98.5 /100 | #95 | Exceptional $47,361 |
Demographics Similar to Immigrants from Israel by Per Capita Income
In terms of per capita income, the demographic groups most similar to Immigrants from Israel are Immigrants from Taiwan ($57,742, a difference of 0.62%), Immigrants from Iran ($57,759, a difference of 0.65%), Immigrants from Australia ($57,953, a difference of 0.99%), Immigrants from Hong Kong ($56,709, a difference of 1.2%), and Immigrants from Ireland ($56,584, a difference of 1.4%).
| Demographics | Rating | Rank | Per Capita Income |
| Filipinos | 100.0 /100 | #1 | Exceptional $59,066 |
| Iranians | 100.0 /100 | #2 | Exceptional $58,786 |
| Immigrants | Singapore | 100.0 /100 | #3 | Exceptional $58,353 |
| Immigrants | Australia | 100.0 /100 | #4 | Exceptional $57,953 |
| Immigrants | Iran | 100.0 /100 | #5 | Exceptional $57,759 |
| Immigrants | Taiwan | 100.0 /100 | #6 | Exceptional $57,742 |
| Immigrants | Israel | 100.0 /100 | #7 | Exceptional $57,384 |
| Immigrants | Hong Kong | 100.0 /100 | #8 | Exceptional $56,709 |
| Immigrants | Ireland | 100.0 /100 | #9 | Exceptional $56,584 |
| Okinawans | 100.0 /100 | #10 | Exceptional $55,817 |
| Eastern Europeans | 100.0 /100 | #11 | Exceptional $55,780 |
| Immigrants | Sweden | 100.0 /100 | #12 | Exceptional $55,582 |
| Immigrants | India | 100.0 /100 | #13 | Exceptional $55,268 |
| Immigrants | Belgium | 100.0 /100 | #14 | Exceptional $55,082 |
| Cypriots | 100.0 /100 | #15 | Exceptional $54,899 |