Croatian vs Immigrants from El Salvador Per Capita Income
COMPARE
Croatian
Immigrants from El Salvador
Per Capita Income
Per Capita Income Comparison
Croatians
Immigrants from El Salvador
$47,742
PER CAPITA INCOME
99.0/ 100
METRIC RATING
88th/ 347
METRIC RANK
$38,394
PER CAPITA INCOME
0.3/ 100
METRIC RATING
274th/ 347
METRIC RANK
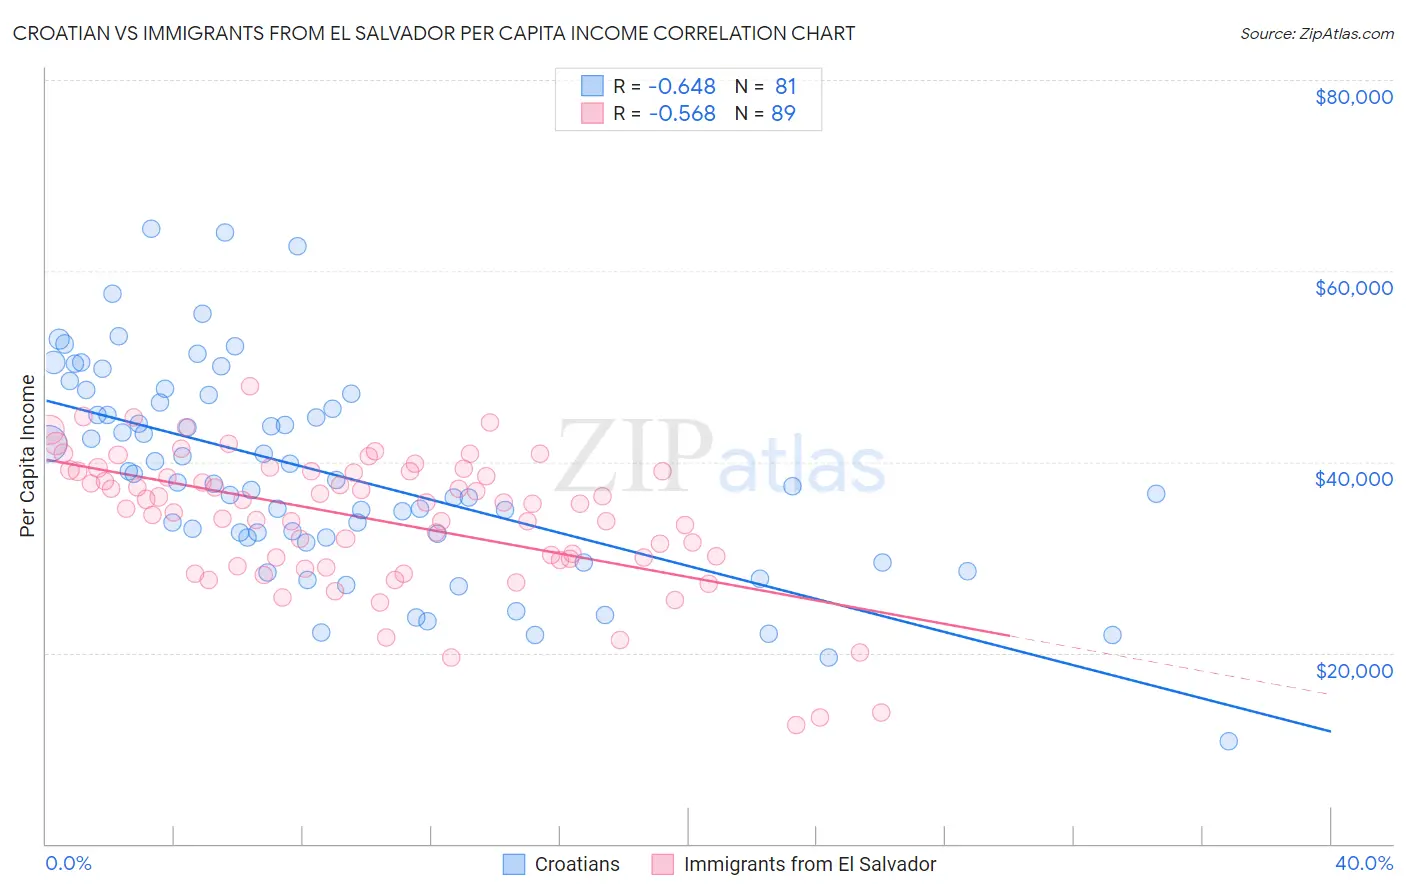
Croatian vs Immigrants from El Salvador Per Capita Income Correlation Chart
The statistical analysis conducted on geographies consisting of 375,755,176 people shows a significant negative correlation between the proportion of Croatians and per capita income in the United States with a correlation coefficient (R) of -0.648 and weighted average of $47,742. Similarly, the statistical analysis conducted on geographies consisting of 357,847,435 people shows a substantial negative correlation between the proportion of Immigrants from El Salvador and per capita income in the United States with a correlation coefficient (R) of -0.568 and weighted average of $38,394, a difference of 24.3%.
Per Capita Income Correlation Summary
| Measurement | Croatian | Immigrants from El Salvador |
| Minimum | $10,765 | $12,473 |
| Maximum | $64,427 | $47,918 |
| Range | $53,662 | $35,445 |
| Mean | $38,757 | $33,959 |
| Median | $37,830 | $35,640 |
| Interquartile 25% (IQ1) | $32,092 | $29,770 |
| Interquartile 75% (IQ3) | $46,598 | $39,011 |
| Interquartile Range (IQR) | $14,505 | $9,240 |
| Standard Deviation (Sample) | $10,847 | $7,077 |
| Standard Deviation (Population) | $10,780 | $7,037 |
Similar Demographics by Per Capita Income
Demographics Similar to Croatians by Per Capita Income
In terms of per capita income, the demographic groups most similar to Croatians are Northern European ($47,698, a difference of 0.090%), Italian ($47,574, a difference of 0.35%), Macedonian ($47,573, a difference of 0.36%), Immigrants from Moldova ($47,489, a difference of 0.53%), and Ukrainian ($48,014, a difference of 0.57%).
| Demographics | Rating | Rank | Per Capita Income |
| Armenians | 99.4 /100 | #81 | Exceptional $48,287 |
| Immigrants | Indonesia | 99.4 /100 | #82 | Exceptional $48,195 |
| Immigrants | Brazil | 99.4 /100 | #83 | Exceptional $48,164 |
| Immigrants | Ukraine | 99.3 /100 | #84 | Exceptional $48,134 |
| Austrians | 99.3 /100 | #85 | Exceptional $48,116 |
| Immigrants | Southern Europe | 99.3 /100 | #86 | Exceptional $48,027 |
| Ukrainians | 99.3 /100 | #87 | Exceptional $48,014 |
| Croatians | 99.0 /100 | #88 | Exceptional $47,742 |
| Northern Europeans | 98.9 /100 | #89 | Exceptional $47,698 |
| Italians | 98.8 /100 | #90 | Exceptional $47,574 |
| Macedonians | 98.8 /100 | #91 | Exceptional $47,573 |
| Immigrants | Moldova | 98.7 /100 | #92 | Exceptional $47,489 |
| Immigrants | Zimbabwe | 98.5 /100 | #93 | Exceptional $47,394 |
| Albanians | 98.5 /100 | #94 | Exceptional $47,379 |
| Immigrants | Egypt | 98.5 /100 | #95 | Exceptional $47,361 |
Demographics Similar to Immigrants from El Salvador by Per Capita Income
In terms of per capita income, the demographic groups most similar to Immigrants from El Salvador are Nepalese ($38,442, a difference of 0.13%), Immigrants from Cabo Verde ($38,540, a difference of 0.38%), Central American ($38,560, a difference of 0.43%), Immigrants from Belize ($38,614, a difference of 0.57%), and Immigrants from Liberia ($38,165, a difference of 0.60%).
| Demographics | Rating | Rank | Per Capita Income |
| Immigrants | Zaire | 0.4 /100 | #267 | Tragic $38,848 |
| Liberians | 0.4 /100 | #268 | Tragic $38,780 |
| Immigrants | Jamaica | 0.4 /100 | #269 | Tragic $38,766 |
| Immigrants | Belize | 0.3 /100 | #270 | Tragic $38,614 |
| Central Americans | 0.3 /100 | #271 | Tragic $38,560 |
| Immigrants | Cabo Verde | 0.3 /100 | #272 | Tragic $38,540 |
| Nepalese | 0.3 /100 | #273 | Tragic $38,442 |
| Immigrants | El Salvador | 0.3 /100 | #274 | Tragic $38,394 |
| Immigrants | Liberia | 0.2 /100 | #275 | Tragic $38,165 |
| Hmong | 0.2 /100 | #276 | Tragic $38,120 |
| Comanche | 0.2 /100 | #277 | Tragic $38,088 |
| Immigrants | Nicaragua | 0.2 /100 | #278 | Tragic $38,065 |
| Colville | 0.2 /100 | #279 | Tragic $38,047 |
| Potawatomi | 0.2 /100 | #280 | Tragic $38,046 |
| Immigrants | Dominica | 0.2 /100 | #281 | Tragic $37,952 |