Croatian vs Cajun Per Capita Income
COMPARE
Croatian
Cajun
Per Capita Income
Per Capita Income Comparison
Croatians
Cajuns
$47,742
PER CAPITA INCOME
99.0/ 100
METRIC RATING
88th/ 347
METRIC RANK
$37,527
PER CAPITA INCOME
0.1/ 100
METRIC RATING
291st/ 347
METRIC RANK
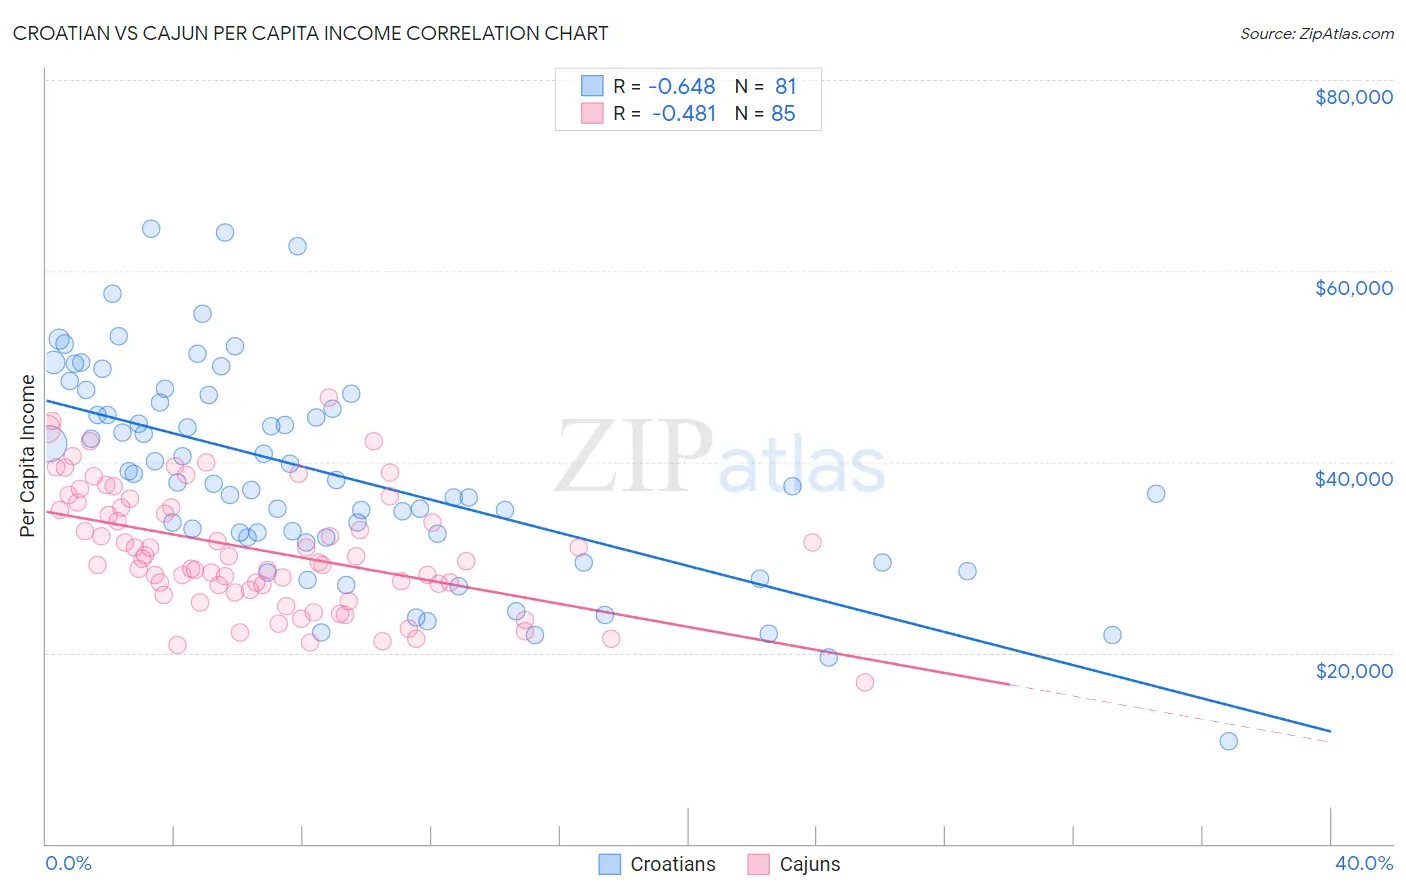
Croatian vs Cajun Per Capita Income Correlation Chart
The statistical analysis conducted on geographies consisting of 375,755,176 people shows a significant negative correlation between the proportion of Croatians and per capita income in the United States with a correlation coefficient (R) of -0.648 and weighted average of $47,742. Similarly, the statistical analysis conducted on geographies consisting of 149,712,942 people shows a moderate negative correlation between the proportion of Cajuns and per capita income in the United States with a correlation coefficient (R) of -0.481 and weighted average of $37,527, a difference of 27.2%.
Per Capita Income Correlation Summary
| Measurement | Croatian | Cajun |
| Minimum | $10,765 | $16,891 |
| Maximum | $64,427 | $46,697 |
| Range | $53,662 | $29,806 |
| Mean | $38,757 | $30,817 |
| Median | $37,830 | $29,870 |
| Interquartile 25% (IQ1) | $32,092 | $26,822 |
| Interquartile 75% (IQ3) | $46,598 | $35,445 |
| Interquartile Range (IQR) | $14,505 | $8,623 |
| Standard Deviation (Sample) | $10,847 | $6,316 |
| Standard Deviation (Population) | $10,780 | $6,279 |
Similar Demographics by Per Capita Income
Demographics Similar to Croatians by Per Capita Income
In terms of per capita income, the demographic groups most similar to Croatians are Northern European ($47,698, a difference of 0.090%), Italian ($47,574, a difference of 0.35%), Macedonian ($47,573, a difference of 0.36%), Immigrants from Moldova ($47,489, a difference of 0.53%), and Ukrainian ($48,014, a difference of 0.57%).
| Demographics | Rating | Rank | Per Capita Income |
| Armenians | 99.4 /100 | #81 | Exceptional $48,287 |
| Immigrants | Indonesia | 99.4 /100 | #82 | Exceptional $48,195 |
| Immigrants | Brazil | 99.4 /100 | #83 | Exceptional $48,164 |
| Immigrants | Ukraine | 99.3 /100 | #84 | Exceptional $48,134 |
| Austrians | 99.3 /100 | #85 | Exceptional $48,116 |
| Immigrants | Southern Europe | 99.3 /100 | #86 | Exceptional $48,027 |
| Ukrainians | 99.3 /100 | #87 | Exceptional $48,014 |
| Croatians | 99.0 /100 | #88 | Exceptional $47,742 |
| Northern Europeans | 98.9 /100 | #89 | Exceptional $47,698 |
| Italians | 98.8 /100 | #90 | Exceptional $47,574 |
| Macedonians | 98.8 /100 | #91 | Exceptional $47,573 |
| Immigrants | Moldova | 98.7 /100 | #92 | Exceptional $47,489 |
| Immigrants | Zimbabwe | 98.5 /100 | #93 | Exceptional $47,394 |
| Albanians | 98.5 /100 | #94 | Exceptional $47,379 |
| Immigrants | Egypt | 98.5 /100 | #95 | Exceptional $47,361 |
Demographics Similar to Cajuns by Per Capita Income
In terms of per capita income, the demographic groups most similar to Cajuns are Immigrants from Guatemala ($37,550, a difference of 0.060%), U.S. Virgin Islander ($37,589, a difference of 0.16%), Immigrants from Micronesia ($37,464, a difference of 0.17%), Mexican American Indian ($37,407, a difference of 0.32%), and Cuban ($37,383, a difference of 0.39%).
| Demographics | Rating | Rank | Per Capita Income |
| Africans | 0.1 /100 | #284 | Tragic $37,785 |
| Guatemalans | 0.1 /100 | #285 | Tragic $37,766 |
| Central American Indians | 0.1 /100 | #286 | Tragic $37,699 |
| Dominicans | 0.1 /100 | #287 | Tragic $37,697 |
| Blackfeet | 0.1 /100 | #288 | Tragic $37,695 |
| U.S. Virgin Islanders | 0.1 /100 | #289 | Tragic $37,589 |
| Immigrants | Guatemala | 0.1 /100 | #290 | Tragic $37,550 |
| Cajuns | 0.1 /100 | #291 | Tragic $37,527 |
| Immigrants | Micronesia | 0.1 /100 | #292 | Tragic $37,464 |
| Mexican American Indians | 0.1 /100 | #293 | Tragic $37,407 |
| Cubans | 0.1 /100 | #294 | Tragic $37,383 |
| Immigrants | Dominican Republic | 0.1 /100 | #295 | Tragic $37,306 |
| Indonesians | 0.1 /100 | #296 | Tragic $37,300 |
| Haitians | 0.1 /100 | #297 | Tragic $37,289 |
| Immigrants | Caribbean | 0.1 /100 | #298 | Tragic $37,254 |