Croatian vs Immigrants from Sierra Leone Per Capita Income
COMPARE
Croatian
Immigrants from Sierra Leone
Per Capita Income
Per Capita Income Comparison
Croatians
Immigrants from Sierra Leone
$47,742
PER CAPITA INCOME
99.0/ 100
METRIC RATING
88th/ 347
METRIC RANK
$42,752
PER CAPITA INCOME
26.5/ 100
METRIC RATING
193rd/ 347
METRIC RANK
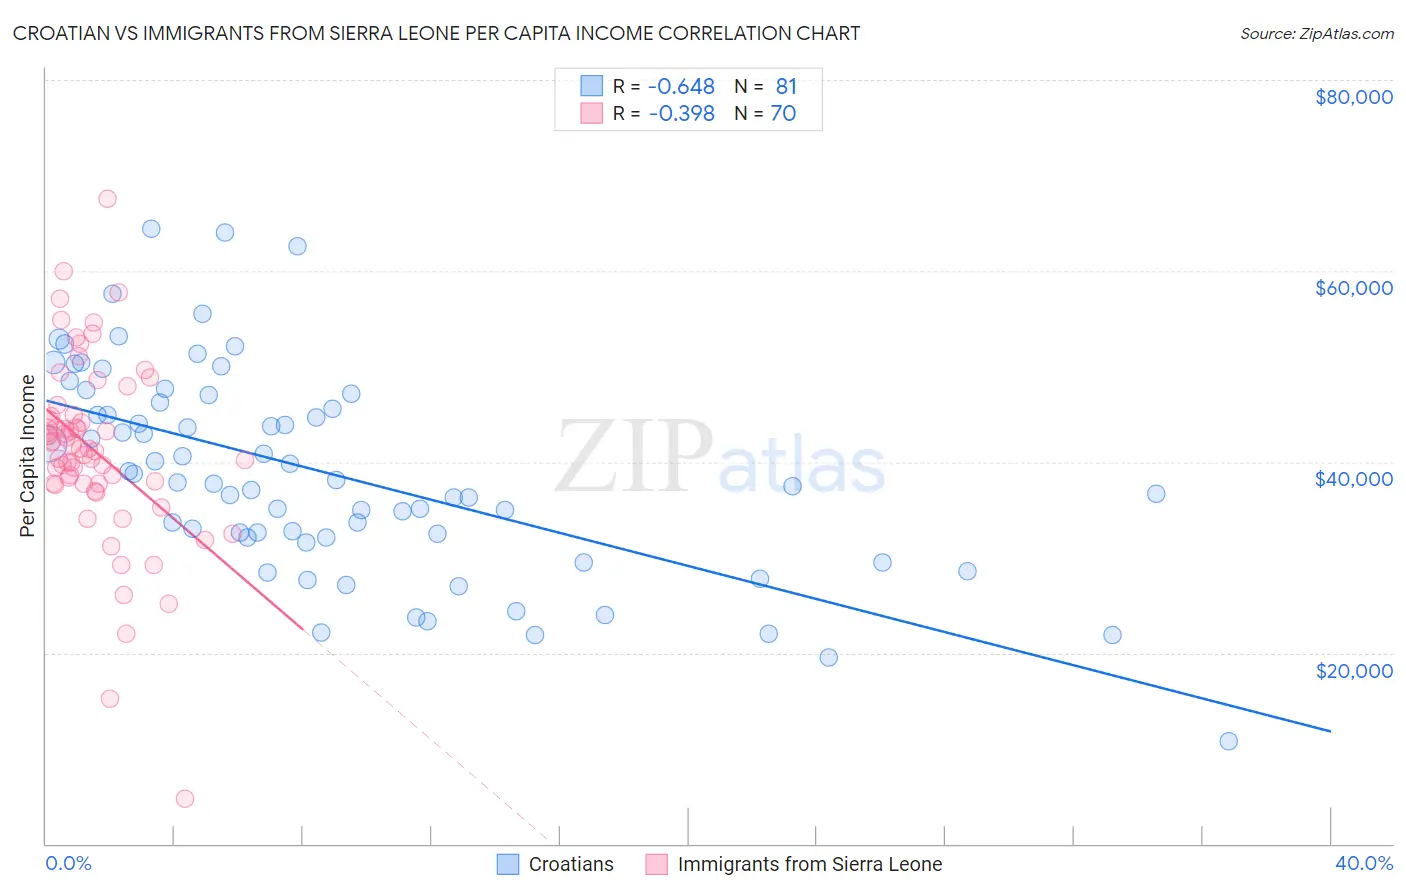
Croatian vs Immigrants from Sierra Leone Per Capita Income Correlation Chart
The statistical analysis conducted on geographies consisting of 375,755,176 people shows a significant negative correlation between the proportion of Croatians and per capita income in the United States with a correlation coefficient (R) of -0.648 and weighted average of $47,742. Similarly, the statistical analysis conducted on geographies consisting of 101,626,660 people shows a mild negative correlation between the proportion of Immigrants from Sierra Leone and per capita income in the United States with a correlation coefficient (R) of -0.398 and weighted average of $42,752, a difference of 11.7%.
Per Capita Income Correlation Summary
| Measurement | Croatian | Immigrants from Sierra Leone |
| Minimum | $10,765 | $4,657 |
| Maximum | $64,427 | $67,610 |
| Range | $53,662 | $62,953 |
| Mean | $38,757 | $41,186 |
| Median | $37,830 | $41,327 |
| Interquartile 25% (IQ1) | $32,092 | $37,712 |
| Interquartile 75% (IQ3) | $46,598 | $44,823 |
| Interquartile Range (IQR) | $14,505 | $7,111 |
| Standard Deviation (Sample) | $10,847 | $9,754 |
| Standard Deviation (Population) | $10,780 | $9,684 |
Similar Demographics by Per Capita Income
Demographics Similar to Croatians by Per Capita Income
In terms of per capita income, the demographic groups most similar to Croatians are Northern European ($47,698, a difference of 0.090%), Italian ($47,574, a difference of 0.35%), Macedonian ($47,573, a difference of 0.36%), Immigrants from Moldova ($47,489, a difference of 0.53%), and Ukrainian ($48,014, a difference of 0.57%).
| Demographics | Rating | Rank | Per Capita Income |
| Armenians | 99.4 /100 | #81 | Exceptional $48,287 |
| Immigrants | Indonesia | 99.4 /100 | #82 | Exceptional $48,195 |
| Immigrants | Brazil | 99.4 /100 | #83 | Exceptional $48,164 |
| Immigrants | Ukraine | 99.3 /100 | #84 | Exceptional $48,134 |
| Austrians | 99.3 /100 | #85 | Exceptional $48,116 |
| Immigrants | Southern Europe | 99.3 /100 | #86 | Exceptional $48,027 |
| Ukrainians | 99.3 /100 | #87 | Exceptional $48,014 |
| Croatians | 99.0 /100 | #88 | Exceptional $47,742 |
| Northern Europeans | 98.9 /100 | #89 | Exceptional $47,698 |
| Italians | 98.8 /100 | #90 | Exceptional $47,574 |
| Macedonians | 98.8 /100 | #91 | Exceptional $47,573 |
| Immigrants | Moldova | 98.7 /100 | #92 | Exceptional $47,489 |
| Immigrants | Zimbabwe | 98.5 /100 | #93 | Exceptional $47,394 |
| Albanians | 98.5 /100 | #94 | Exceptional $47,379 |
| Immigrants | Egypt | 98.5 /100 | #95 | Exceptional $47,361 |
Demographics Similar to Immigrants from Sierra Leone by Per Capita Income
In terms of per capita income, the demographic groups most similar to Immigrants from Sierra Leone are Iraqi ($42,760, a difference of 0.020%), Yugoslavian ($42,792, a difference of 0.090%), Kenyan ($42,808, a difference of 0.13%), Immigrants from Fiji ($42,694, a difference of 0.13%), and Immigrants from Kenya ($42,661, a difference of 0.21%).
| Demographics | Rating | Rank | Per Capita Income |
| French Canadians | 32.3 /100 | #186 | Fair $43,003 |
| Immigrants | Colombia | 31.5 /100 | #187 | Fair $42,971 |
| Immigrants | Africa | 31.0 /100 | #188 | Fair $42,950 |
| Bermudans | 30.1 /100 | #189 | Fair $42,911 |
| Kenyans | 27.7 /100 | #190 | Fair $42,808 |
| Yugoslavians | 27.4 /100 | #191 | Fair $42,792 |
| Iraqis | 26.7 /100 | #192 | Fair $42,760 |
| Immigrants | Sierra Leone | 26.5 /100 | #193 | Fair $42,752 |
| Immigrants | Fiji | 25.2 /100 | #194 | Fair $42,694 |
| Immigrants | Kenya | 24.5 /100 | #195 | Fair $42,661 |
| Dutch | 23.4 /100 | #196 | Fair $42,605 |
| Scotch-Irish | 22.6 /100 | #197 | Fair $42,563 |
| Immigrants | Portugal | 19.7 /100 | #198 | Poor $42,412 |
| Barbadians | 19.6 /100 | #199 | Poor $42,406 |
| Vietnamese | 19.0 /100 | #200 | Poor $42,368 |