Native/Alaskan vs Immigrants from Yemen Per Capita Income
COMPARE
Native/Alaskan
Immigrants from Yemen
Per Capita Income
Per Capita Income Comparison
Natives/Alaskans
Immigrants from Yemen
$33,279
PER CAPITA INCOME
0.0/ 100
METRIC RATING
334th/ 347
METRIC RANK
$33,696
PER CAPITA INCOME
0.0/ 100
METRIC RATING
333rd/ 347
METRIC RANK
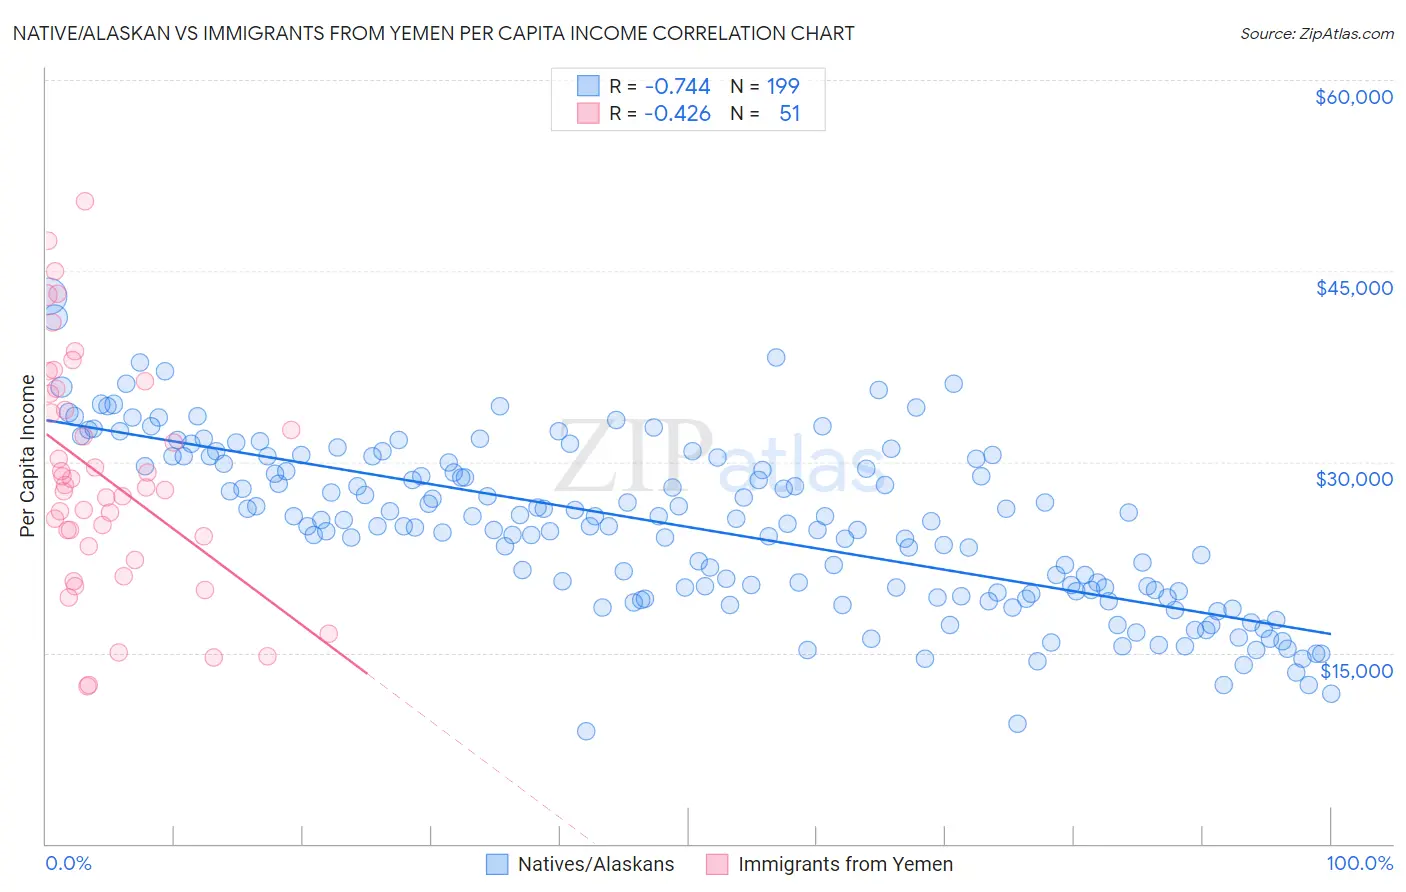
Native/Alaskan vs Immigrants from Yemen Per Capita Income Correlation Chart
The statistical analysis conducted on geographies consisting of 513,079,708 people shows a strong negative correlation between the proportion of Natives/Alaskans and per capita income in the United States with a correlation coefficient (R) of -0.744 and weighted average of $33,279. Similarly, the statistical analysis conducted on geographies consisting of 82,433,611 people shows a moderate negative correlation between the proportion of Immigrants from Yemen and per capita income in the United States with a correlation coefficient (R) of -0.426 and weighted average of $33,696, a difference of 1.3%.
Per Capita Income Correlation Summary
| Measurement | Native/Alaskan | Immigrants from Yemen |
| Minimum | $8,837 | $12,331 |
| Maximum | $43,037 | $50,453 |
| Range | $34,200 | $38,122 |
| Mean | $24,883 | $28,807 |
| Median | $25,158 | $28,035 |
| Interquartile 25% (IQ1) | $19,735 | $23,368 |
| Interquartile 75% (IQ3) | $30,217 | $35,374 |
| Interquartile Range (IQR) | $10,482 | $12,006 |
| Standard Deviation (Sample) | $6,547 | $8,972 |
| Standard Deviation (Population) | $6,531 | $8,883 |
Demographics Similar to Natives/Alaskans and Immigrants from Yemen by Per Capita Income
In terms of per capita income, the demographic groups most similar to Natives/Alaskans are Yuman ($33,236, a difference of 0.13%), Yakama ($33,009, a difference of 0.82%), Houma ($32,996, a difference of 0.86%), Sioux ($33,921, a difference of 1.9%), and Immigrants from Mexico ($33,931, a difference of 2.0%). Similarly, the demographic groups most similar to Immigrants from Yemen are Sioux ($33,921, a difference of 0.67%), Immigrants from Mexico ($33,931, a difference of 0.70%), Yuman ($33,236, a difference of 1.4%), Spanish American Indian ($34,195, a difference of 1.5%), and Yakama ($33,009, a difference of 2.1%).
| Demographics | Rating | Rank | Per Capita Income |
| Cheyenne | 0.0 /100 | #323 | Tragic $35,276 |
| Kiowa | 0.0 /100 | #324 | Tragic $35,102 |
| Immigrants | Central America | 0.0 /100 | #325 | Tragic $34,974 |
| Immigrants | Cuba | 0.0 /100 | #326 | Tragic $34,910 |
| Apache | 0.0 /100 | #327 | Tragic $34,886 |
| Menominee | 0.0 /100 | #328 | Tragic $34,578 |
| Mexicans | 0.0 /100 | #329 | Tragic $34,559 |
| Spanish American Indians | 0.0 /100 | #330 | Tragic $34,195 |
| Immigrants | Mexico | 0.0 /100 | #331 | Tragic $33,931 |
| Sioux | 0.0 /100 | #332 | Tragic $33,921 |
| Immigrants | Yemen | 0.0 /100 | #333 | Tragic $33,696 |
| Natives/Alaskans | 0.0 /100 | #334 | Tragic $33,279 |
| Yuman | 0.0 /100 | #335 | Tragic $33,236 |
| Yakama | 0.0 /100 | #336 | Tragic $33,009 |
| Houma | 0.0 /100 | #337 | Tragic $32,996 |
| Arapaho | 0.0 /100 | #338 | Tragic $32,345 |
| Pueblo | 0.0 /100 | #339 | Tragic $32,012 |
| Crow | 0.0 /100 | #340 | Tragic $31,729 |
| Puerto Ricans | 0.0 /100 | #341 | Tragic $31,268 |
| Hopi | 0.0 /100 | #342 | Tragic $31,177 |
| Pima | 0.0 /100 | #343 | Tragic $30,644 |