Okinawan vs Immigrants from Sierra Leone Per Capita Income
COMPARE
Okinawan
Immigrants from Sierra Leone
Per Capita Income
Per Capita Income Comparison
Okinawans
Immigrants from Sierra Leone
$55,817
PER CAPITA INCOME
100.0/ 100
METRIC RATING
10th/ 347
METRIC RANK
$42,752
PER CAPITA INCOME
26.5/ 100
METRIC RATING
193rd/ 347
METRIC RANK
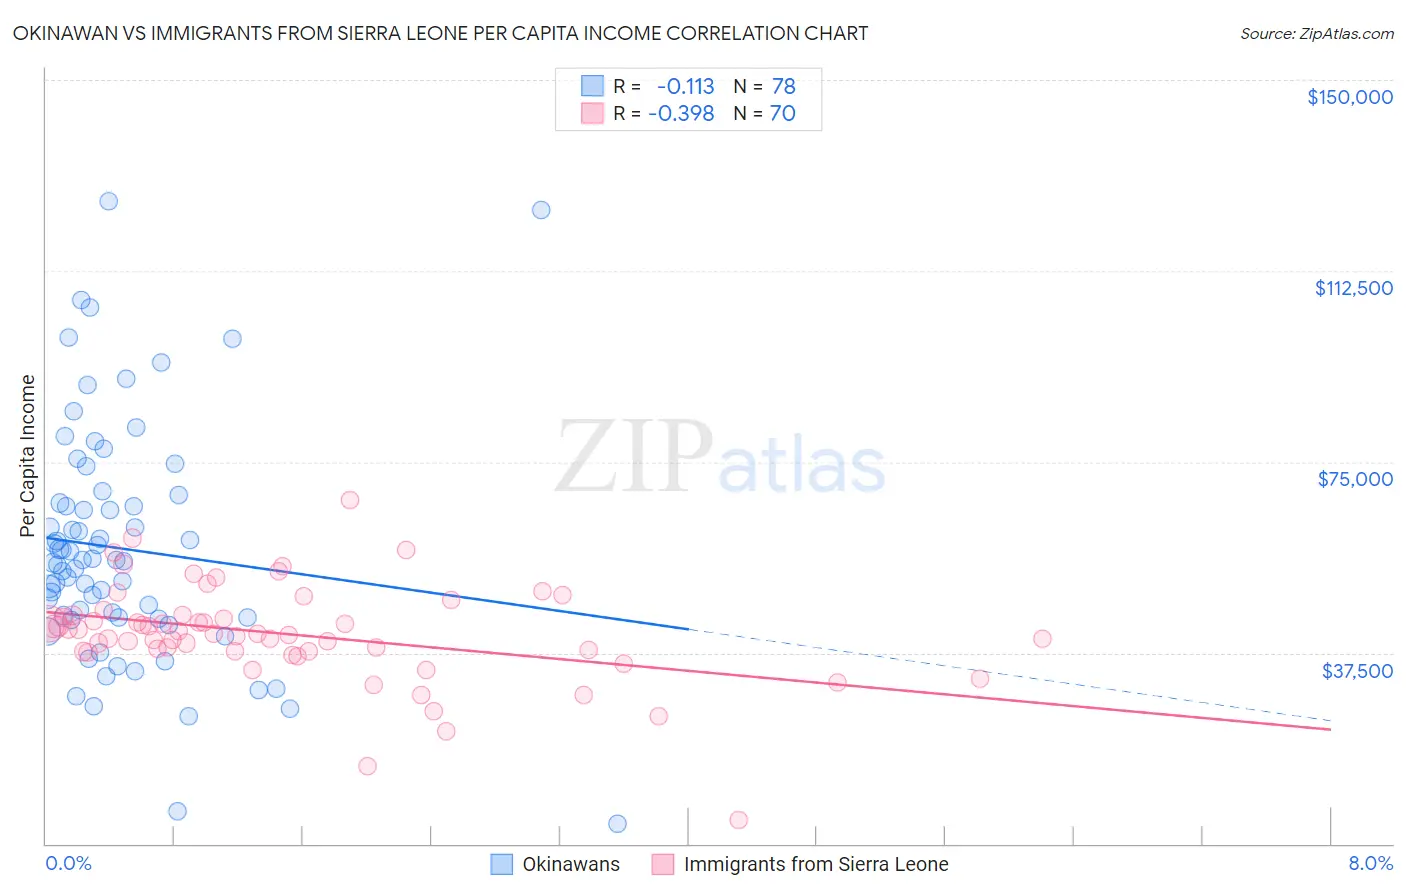
Okinawan vs Immigrants from Sierra Leone Per Capita Income Correlation Chart
The statistical analysis conducted on geographies consisting of 73,745,153 people shows a poor negative correlation between the proportion of Okinawans and per capita income in the United States with a correlation coefficient (R) of -0.113 and weighted average of $55,817. Similarly, the statistical analysis conducted on geographies consisting of 101,626,660 people shows a mild negative correlation between the proportion of Immigrants from Sierra Leone and per capita income in the United States with a correlation coefficient (R) of -0.398 and weighted average of $42,752, a difference of 30.6%.
Per Capita Income Correlation Summary
| Measurement | Okinawan | Immigrants from Sierra Leone |
| Minimum | $4,017 | $4,657 |
| Maximum | $126,204 | $67,610 |
| Range | $122,187 | $62,953 |
| Mean | $57,948 | $41,186 |
| Median | $55,509 | $41,327 |
| Interquartile 25% (IQ1) | $44,396 | $37,712 |
| Interquartile 75% (IQ3) | $66,910 | $44,823 |
| Interquartile Range (IQR) | $22,513 | $7,111 |
| Standard Deviation (Sample) | $23,213 | $9,754 |
| Standard Deviation (Population) | $23,064 | $9,684 |
Similar Demographics by Per Capita Income
Demographics Similar to Okinawans by Per Capita Income
In terms of per capita income, the demographic groups most similar to Okinawans are Eastern European ($55,780, a difference of 0.070%), Immigrants from Sweden ($55,582, a difference of 0.42%), Immigrants from India ($55,268, a difference of 0.99%), Immigrants from Belgium ($55,082, a difference of 1.3%), and Immigrants from Ireland ($56,584, a difference of 1.4%).
| Demographics | Rating | Rank | Per Capita Income |
| Immigrants | Singapore | 100.0 /100 | #3 | Exceptional $58,353 |
| Immigrants | Australia | 100.0 /100 | #4 | Exceptional $57,953 |
| Immigrants | Iran | 100.0 /100 | #5 | Exceptional $57,759 |
| Immigrants | Taiwan | 100.0 /100 | #6 | Exceptional $57,742 |
| Immigrants | Israel | 100.0 /100 | #7 | Exceptional $57,384 |
| Immigrants | Hong Kong | 100.0 /100 | #8 | Exceptional $56,709 |
| Immigrants | Ireland | 100.0 /100 | #9 | Exceptional $56,584 |
| Okinawans | 100.0 /100 | #10 | Exceptional $55,817 |
| Eastern Europeans | 100.0 /100 | #11 | Exceptional $55,780 |
| Immigrants | Sweden | 100.0 /100 | #12 | Exceptional $55,582 |
| Immigrants | India | 100.0 /100 | #13 | Exceptional $55,268 |
| Immigrants | Belgium | 100.0 /100 | #14 | Exceptional $55,082 |
| Cypriots | 100.0 /100 | #15 | Exceptional $54,899 |
| Immigrants | Switzerland | 100.0 /100 | #16 | Exceptional $54,866 |
| Immigrants | France | 100.0 /100 | #17 | Exceptional $54,557 |
Demographics Similar to Immigrants from Sierra Leone by Per Capita Income
In terms of per capita income, the demographic groups most similar to Immigrants from Sierra Leone are Iraqi ($42,760, a difference of 0.020%), Yugoslavian ($42,792, a difference of 0.090%), Kenyan ($42,808, a difference of 0.13%), Immigrants from Fiji ($42,694, a difference of 0.13%), and Immigrants from Kenya ($42,661, a difference of 0.21%).
| Demographics | Rating | Rank | Per Capita Income |
| French Canadians | 32.3 /100 | #186 | Fair $43,003 |
| Immigrants | Colombia | 31.5 /100 | #187 | Fair $42,971 |
| Immigrants | Africa | 31.0 /100 | #188 | Fair $42,950 |
| Bermudans | 30.1 /100 | #189 | Fair $42,911 |
| Kenyans | 27.7 /100 | #190 | Fair $42,808 |
| Yugoslavians | 27.4 /100 | #191 | Fair $42,792 |
| Iraqis | 26.7 /100 | #192 | Fair $42,760 |
| Immigrants | Sierra Leone | 26.5 /100 | #193 | Fair $42,752 |
| Immigrants | Fiji | 25.2 /100 | #194 | Fair $42,694 |
| Immigrants | Kenya | 24.5 /100 | #195 | Fair $42,661 |
| Dutch | 23.4 /100 | #196 | Fair $42,605 |
| Scotch-Irish | 22.6 /100 | #197 | Fair $42,563 |
| Immigrants | Portugal | 19.7 /100 | #198 | Poor $42,412 |
| Barbadians | 19.6 /100 | #199 | Poor $42,406 |
| Vietnamese | 19.0 /100 | #200 | Poor $42,368 |