Immigrants from Norway vs Immigrants from Sierra Leone Per Capita Income
COMPARE
Immigrants from Norway
Immigrants from Sierra Leone
Per Capita Income
Per Capita Income Comparison
Immigrants from Norway
Immigrants from Sierra Leone
$52,217
PER CAPITA INCOME
100.0/ 100
METRIC RATING
32nd/ 347
METRIC RANK
$42,752
PER CAPITA INCOME
26.5/ 100
METRIC RATING
193rd/ 347
METRIC RANK
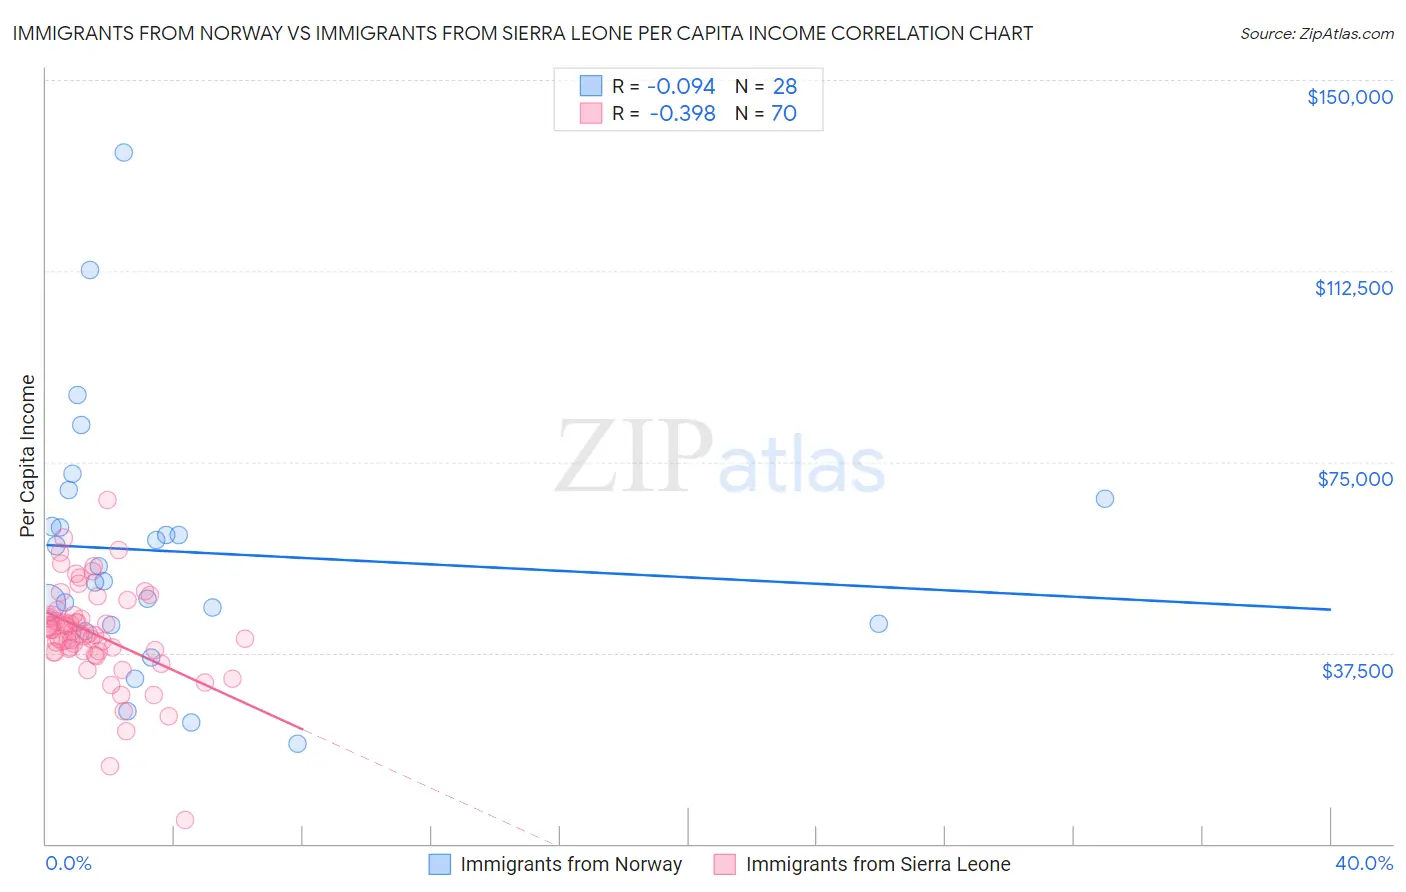
Immigrants from Norway vs Immigrants from Sierra Leone Per Capita Income Correlation Chart
The statistical analysis conducted on geographies consisting of 116,714,031 people shows a slight negative correlation between the proportion of Immigrants from Norway and per capita income in the United States with a correlation coefficient (R) of -0.094 and weighted average of $52,217. Similarly, the statistical analysis conducted on geographies consisting of 101,626,660 people shows a mild negative correlation between the proportion of Immigrants from Sierra Leone and per capita income in the United States with a correlation coefficient (R) of -0.398 and weighted average of $42,752, a difference of 22.1%.
Per Capita Income Correlation Summary
| Measurement | Immigrants from Norway | Immigrants from Sierra Leone |
| Minimum | $19,734 | $4,657 |
| Maximum | $135,828 | $67,610 |
| Range | $116,094 | $62,953 |
| Mean | $57,343 | $41,186 |
| Median | $53,027 | $41,327 |
| Interquartile 25% (IQ1) | $43,092 | $37,712 |
| Interquartile 75% (IQ3) | $65,016 | $44,823 |
| Interquartile Range (IQR) | $21,924 | $7,111 |
| Standard Deviation (Sample) | $25,135 | $9,754 |
| Standard Deviation (Population) | $24,682 | $9,684 |
Similar Demographics by Per Capita Income
Demographics Similar to Immigrants from Norway by Per Capita Income
In terms of per capita income, the demographic groups most similar to Immigrants from Norway are Australian ($52,074, a difference of 0.27%), Turkish ($52,391, a difference of 0.33%), Immigrants from Russia ($52,044, a difference of 0.33%), Burmese ($52,005, a difference of 0.41%), and Immigrants from Austria ($52,503, a difference of 0.55%).
| Demographics | Rating | Rank | Per Capita Income |
| Immigrants | Japan | 100.0 /100 | #25 | Exceptional $53,359 |
| Russians | 100.0 /100 | #26 | Exceptional $53,154 |
| Immigrants | South Central Asia | 100.0 /100 | #27 | Exceptional $52,660 |
| Latvians | 100.0 /100 | #28 | Exceptional $52,649 |
| Israelis | 100.0 /100 | #29 | Exceptional $52,596 |
| Immigrants | Austria | 100.0 /100 | #30 | Exceptional $52,503 |
| Turks | 100.0 /100 | #31 | Exceptional $52,391 |
| Immigrants | Norway | 100.0 /100 | #32 | Exceptional $52,217 |
| Australians | 100.0 /100 | #33 | Exceptional $52,074 |
| Immigrants | Russia | 100.0 /100 | #34 | Exceptional $52,044 |
| Burmese | 100.0 /100 | #35 | Exceptional $52,005 |
| Immigrants | Greece | 100.0 /100 | #36 | Exceptional $51,891 |
| Estonians | 100.0 /100 | #37 | Exceptional $51,875 |
| Immigrants | Czechoslovakia | 100.0 /100 | #38 | Exceptional $51,770 |
| Cambodians | 100.0 /100 | #39 | Exceptional $51,731 |
Demographics Similar to Immigrants from Sierra Leone by Per Capita Income
In terms of per capita income, the demographic groups most similar to Immigrants from Sierra Leone are Iraqi ($42,760, a difference of 0.020%), Yugoslavian ($42,792, a difference of 0.090%), Kenyan ($42,808, a difference of 0.13%), Immigrants from Fiji ($42,694, a difference of 0.13%), and Immigrants from Kenya ($42,661, a difference of 0.21%).
| Demographics | Rating | Rank | Per Capita Income |
| French Canadians | 32.3 /100 | #186 | Fair $43,003 |
| Immigrants | Colombia | 31.5 /100 | #187 | Fair $42,971 |
| Immigrants | Africa | 31.0 /100 | #188 | Fair $42,950 |
| Bermudans | 30.1 /100 | #189 | Fair $42,911 |
| Kenyans | 27.7 /100 | #190 | Fair $42,808 |
| Yugoslavians | 27.4 /100 | #191 | Fair $42,792 |
| Iraqis | 26.7 /100 | #192 | Fair $42,760 |
| Immigrants | Sierra Leone | 26.5 /100 | #193 | Fair $42,752 |
| Immigrants | Fiji | 25.2 /100 | #194 | Fair $42,694 |
| Immigrants | Kenya | 24.5 /100 | #195 | Fair $42,661 |
| Dutch | 23.4 /100 | #196 | Fair $42,605 |
| Scotch-Irish | 22.6 /100 | #197 | Fair $42,563 |
| Immigrants | Portugal | 19.7 /100 | #198 | Poor $42,412 |
| Barbadians | 19.6 /100 | #199 | Poor $42,406 |
| Vietnamese | 19.0 /100 | #200 | Poor $42,368 |