Uruguayan vs Cajun Per Capita Income
COMPARE
Uruguayan
Cajun
Per Capita Income
Per Capita Income Comparison
Uruguayans
Cajuns
$44,318
PER CAPITA INCOME
67.6/ 100
METRIC RATING
155th/ 347
METRIC RANK
$37,527
PER CAPITA INCOME
0.1/ 100
METRIC RATING
291st/ 347
METRIC RANK
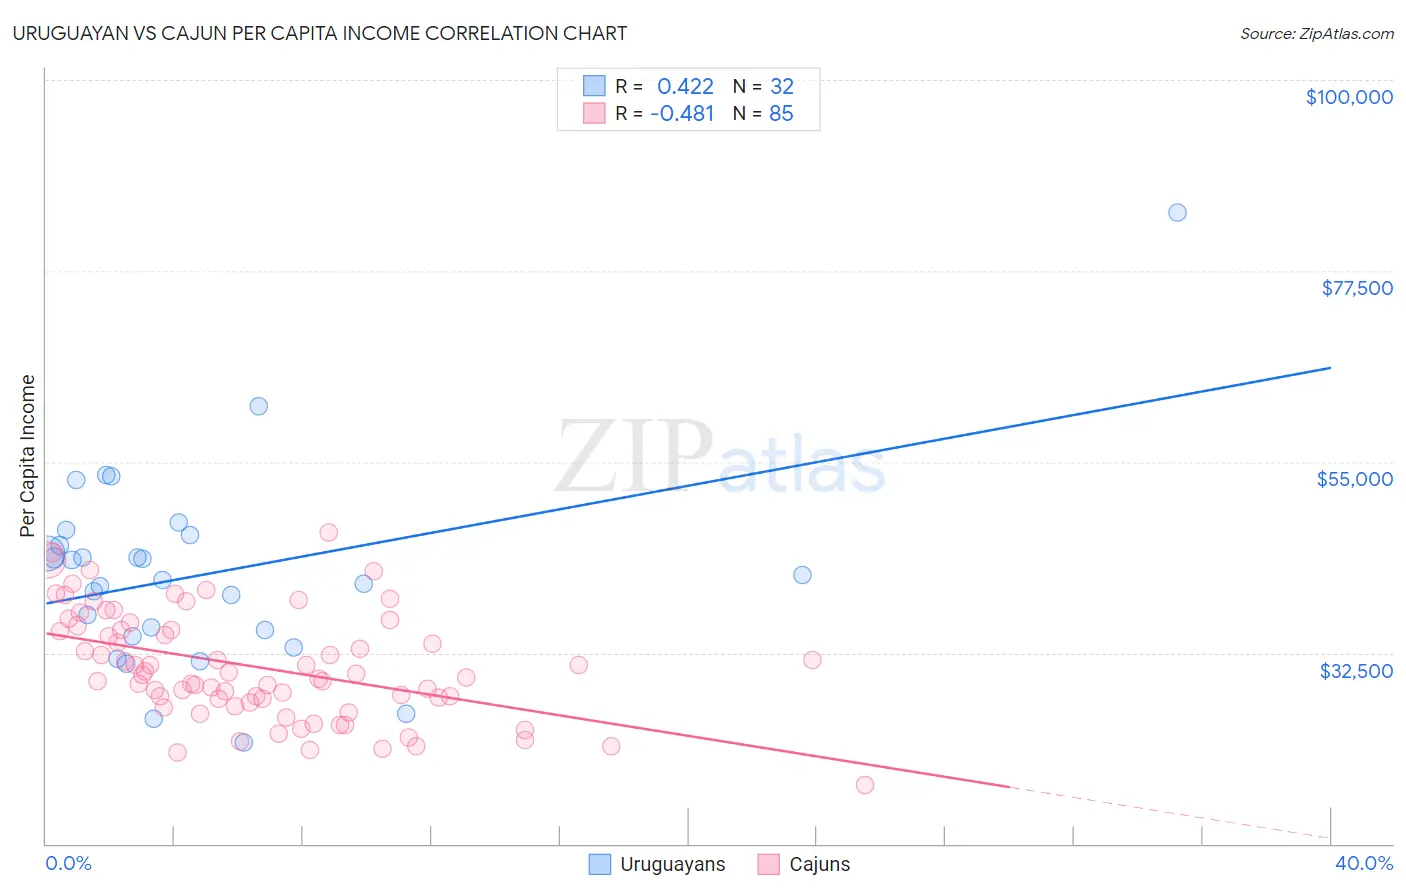
Uruguayan vs Cajun Per Capita Income Correlation Chart
The statistical analysis conducted on geographies consisting of 144,785,218 people shows a moderate positive correlation between the proportion of Uruguayans and per capita income in the United States with a correlation coefficient (R) of 0.422 and weighted average of $44,318. Similarly, the statistical analysis conducted on geographies consisting of 149,712,942 people shows a moderate negative correlation between the proportion of Cajuns and per capita income in the United States with a correlation coefficient (R) of -0.481 and weighted average of $37,527, a difference of 18.1%.
Per Capita Income Correlation Summary
| Measurement | Uruguayan | Cajun |
| Minimum | $21,859 | $16,891 |
| Maximum | $84,313 | $46,697 |
| Range | $62,454 | $29,806 |
| Mean | $41,831 | $30,817 |
| Median | $41,436 | $29,870 |
| Interquartile 25% (IQ1) | $34,824 | $26,822 |
| Interquartile 75% (IQ3) | $45,774 | $35,445 |
| Interquartile Range (IQR) | $10,950 | $8,623 |
| Standard Deviation (Sample) | $11,692 | $6,316 |
| Standard Deviation (Population) | $11,508 | $6,279 |
Similar Demographics by Per Capita Income
Demographics Similar to Uruguayans by Per Capita Income
In terms of per capita income, the demographic groups most similar to Uruguayans are Portuguese ($44,362, a difference of 0.10%), Slovak ($44,229, a difference of 0.20%), South American Indian ($44,206, a difference of 0.25%), Scottish ($44,440, a difference of 0.27%), and Immigrants from Nepal ($44,187, a difference of 0.30%).
| Demographics | Rating | Rank | Per Capita Income |
| Immigrants | Armenia | 73.1 /100 | #148 | Good $44,552 |
| Koreans | 72.5 /100 | #149 | Good $44,522 |
| Immigrants | Eritrea | 72.1 /100 | #150 | Good $44,509 |
| Norwegians | 71.5 /100 | #151 | Good $44,480 |
| Peruvians | 71.5 /100 | #152 | Good $44,479 |
| Scottish | 70.6 /100 | #153 | Good $44,440 |
| Portuguese | 68.7 /100 | #154 | Good $44,362 |
| Uruguayans | 67.6 /100 | #155 | Good $44,318 |
| Slovaks | 65.4 /100 | #156 | Good $44,229 |
| South American Indians | 64.8 /100 | #157 | Good $44,206 |
| Immigrants | Nepal | 64.3 /100 | #158 | Good $44,187 |
| South Americans | 62.4 /100 | #159 | Good $44,114 |
| Danes | 61.9 /100 | #160 | Good $44,095 |
| Costa Ricans | 61.8 /100 | #161 | Good $44,090 |
| Swiss | 61.4 /100 | #162 | Good $44,076 |
Demographics Similar to Cajuns by Per Capita Income
In terms of per capita income, the demographic groups most similar to Cajuns are Immigrants from Guatemala ($37,550, a difference of 0.060%), U.S. Virgin Islander ($37,589, a difference of 0.16%), Immigrants from Micronesia ($37,464, a difference of 0.17%), Mexican American Indian ($37,407, a difference of 0.32%), and Cuban ($37,383, a difference of 0.39%).
| Demographics | Rating | Rank | Per Capita Income |
| Africans | 0.1 /100 | #284 | Tragic $37,785 |
| Guatemalans | 0.1 /100 | #285 | Tragic $37,766 |
| Central American Indians | 0.1 /100 | #286 | Tragic $37,699 |
| Dominicans | 0.1 /100 | #287 | Tragic $37,697 |
| Blackfeet | 0.1 /100 | #288 | Tragic $37,695 |
| U.S. Virgin Islanders | 0.1 /100 | #289 | Tragic $37,589 |
| Immigrants | Guatemala | 0.1 /100 | #290 | Tragic $37,550 |
| Cajuns | 0.1 /100 | #291 | Tragic $37,527 |
| Immigrants | Micronesia | 0.1 /100 | #292 | Tragic $37,464 |
| Mexican American Indians | 0.1 /100 | #293 | Tragic $37,407 |
| Cubans | 0.1 /100 | #294 | Tragic $37,383 |
| Immigrants | Dominican Republic | 0.1 /100 | #295 | Tragic $37,306 |
| Indonesians | 0.1 /100 | #296 | Tragic $37,300 |
| Haitians | 0.1 /100 | #297 | Tragic $37,289 |
| Immigrants | Caribbean | 0.1 /100 | #298 | Tragic $37,254 |