Immigrants from Honduras vs Cajun Per Capita Income
COMPARE
Immigrants from Honduras
Cajun
Per Capita Income
Per Capita Income Comparison
Immigrants from Honduras
Cajuns
$36,665
PER CAPITA INCOME
0.0/ 100
METRIC RATING
309th/ 347
METRIC RANK
$37,527
PER CAPITA INCOME
0.1/ 100
METRIC RATING
291st/ 347
METRIC RANK
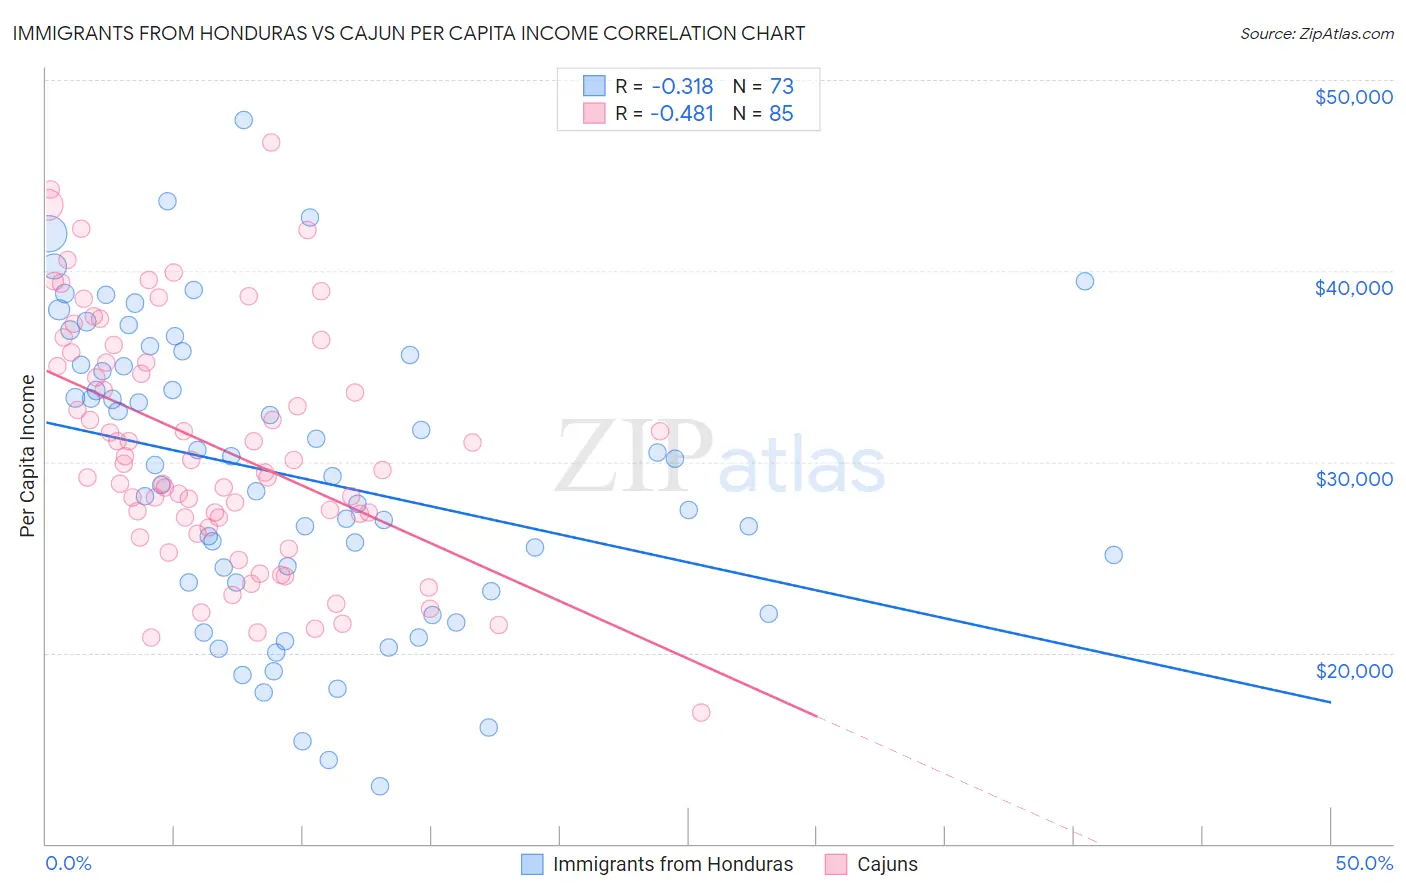
Immigrants from Honduras vs Cajun Per Capita Income Correlation Chart
The statistical analysis conducted on geographies consisting of 322,641,994 people shows a mild negative correlation between the proportion of Immigrants from Honduras and per capita income in the United States with a correlation coefficient (R) of -0.318 and weighted average of $36,665. Similarly, the statistical analysis conducted on geographies consisting of 149,712,942 people shows a moderate negative correlation between the proportion of Cajuns and per capita income in the United States with a correlation coefficient (R) of -0.481 and weighted average of $37,527, a difference of 2.4%.
Per Capita Income Correlation Summary
| Measurement | Immigrants from Honduras | Cajun |
| Minimum | $13,018 | $16,891 |
| Maximum | $47,908 | $46,697 |
| Range | $34,890 | $29,806 |
| Mean | $29,255 | $30,817 |
| Median | $29,272 | $29,870 |
| Interquartile 25% (IQ1) | $23,483 | $26,822 |
| Interquartile 75% (IQ3) | $35,344 | $35,445 |
| Interquartile Range (IQR) | $11,861 | $8,623 |
| Standard Deviation (Sample) | $7,769 | $6,316 |
| Standard Deviation (Population) | $7,715 | $6,279 |
Demographics Similar to Immigrants from Honduras and Cajuns by Per Capita Income
In terms of per capita income, the demographic groups most similar to Immigrants from Honduras are Ute ($36,651, a difference of 0.040%), Fijian ($36,690, a difference of 0.070%), Immigrants from Latin America ($36,823, a difference of 0.43%), Immigrants from Haiti ($36,849, a difference of 0.50%), and Inupiat ($36,999, a difference of 0.91%). Similarly, the demographic groups most similar to Cajuns are Immigrants from Guatemala ($37,550, a difference of 0.060%), Immigrants from Micronesia ($37,464, a difference of 0.17%), Mexican American Indian ($37,407, a difference of 0.32%), Cuban ($37,383, a difference of 0.39%), and Immigrants from Dominican Republic ($37,306, a difference of 0.59%).
| Demographics | Rating | Rank | Per Capita Income |
| Immigrants | Guatemala | 0.1 /100 | #290 | Tragic $37,550 |
| Cajuns | 0.1 /100 | #291 | Tragic $37,527 |
| Immigrants | Micronesia | 0.1 /100 | #292 | Tragic $37,464 |
| Mexican American Indians | 0.1 /100 | #293 | Tragic $37,407 |
| Cubans | 0.1 /100 | #294 | Tragic $37,383 |
| Immigrants | Dominican Republic | 0.1 /100 | #295 | Tragic $37,306 |
| Indonesians | 0.1 /100 | #296 | Tragic $37,300 |
| Haitians | 0.1 /100 | #297 | Tragic $37,289 |
| Immigrants | Caribbean | 0.1 /100 | #298 | Tragic $37,254 |
| Cherokee | 0.1 /100 | #299 | Tragic $37,203 |
| Immigrants | Bahamas | 0.1 /100 | #300 | Tragic $37,193 |
| Ottawa | 0.1 /100 | #301 | Tragic $37,101 |
| Shoshone | 0.1 /100 | #302 | Tragic $37,072 |
| Paiute | 0.1 /100 | #303 | Tragic $37,066 |
| Hondurans | 0.1 /100 | #304 | Tragic $37,031 |
| Inupiat | 0.1 /100 | #305 | Tragic $36,999 |
| Immigrants | Haiti | 0.0 /100 | #306 | Tragic $36,849 |
| Immigrants | Latin America | 0.0 /100 | #307 | Tragic $36,823 |
| Fijians | 0.0 /100 | #308 | Tragic $36,690 |
| Immigrants | Honduras | 0.0 /100 | #309 | Tragic $36,665 |
| Ute | 0.0 /100 | #310 | Tragic $36,651 |