Immigrants from Dominican Republic vs Cajun Per Capita Income
COMPARE
Immigrants from Dominican Republic
Cajun
Per Capita Income
Per Capita Income Comparison
Immigrants from Dominican Republic
Cajuns
$37,306
PER CAPITA INCOME
0.1/ 100
METRIC RATING
295th/ 347
METRIC RANK
$37,527
PER CAPITA INCOME
0.1/ 100
METRIC RATING
291st/ 347
METRIC RANK
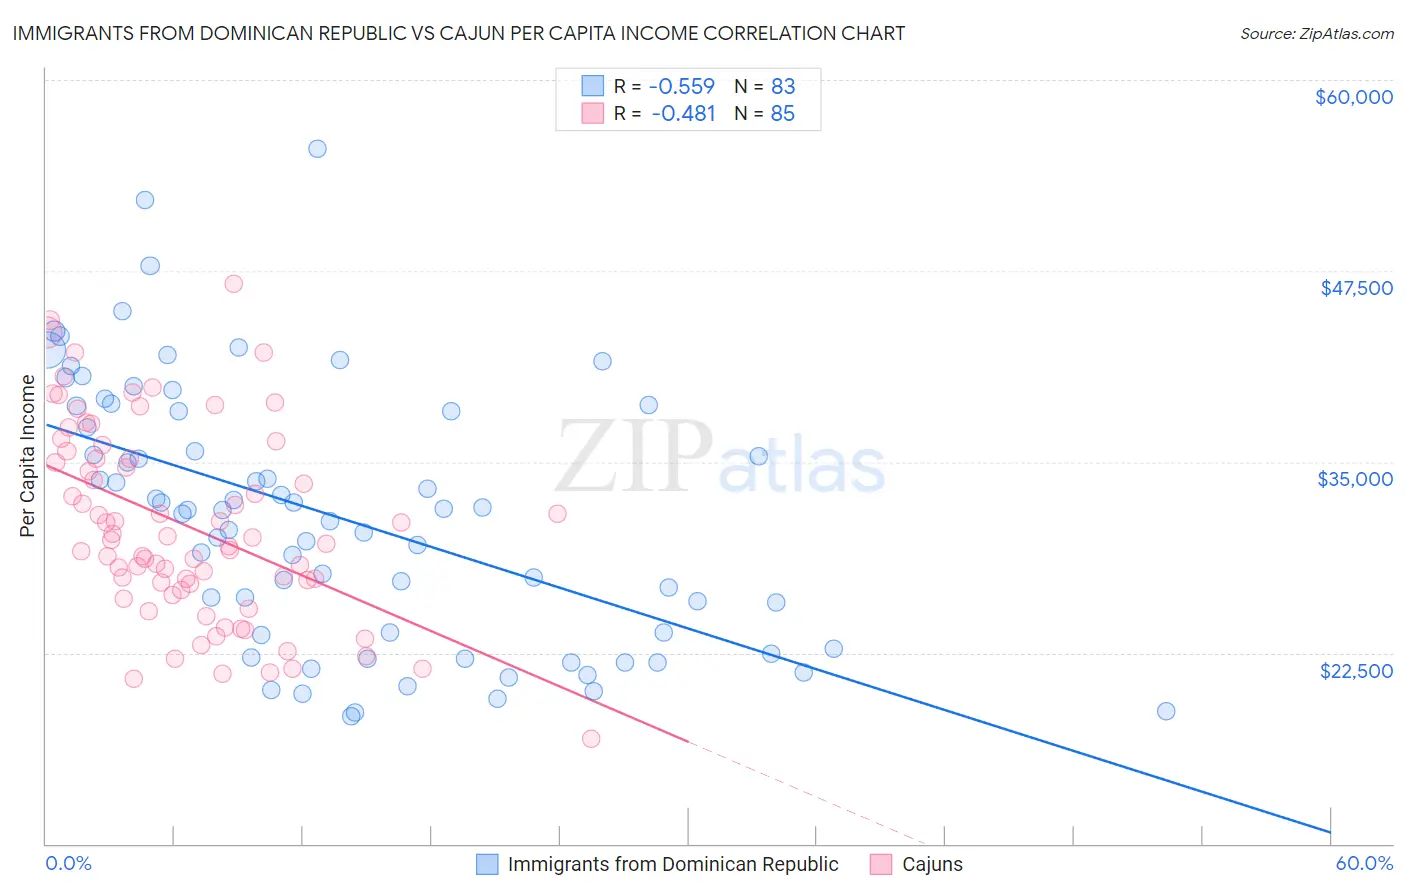
Immigrants from Dominican Republic vs Cajun Per Capita Income Correlation Chart
The statistical analysis conducted on geographies consisting of 275,145,161 people shows a substantial negative correlation between the proportion of Immigrants from Dominican Republic and per capita income in the United States with a correlation coefficient (R) of -0.559 and weighted average of $37,306. Similarly, the statistical analysis conducted on geographies consisting of 149,712,942 people shows a moderate negative correlation between the proportion of Cajuns and per capita income in the United States with a correlation coefficient (R) of -0.481 and weighted average of $37,527, a difference of 0.59%.
Per Capita Income Correlation Summary
| Measurement | Immigrants from Dominican Republic | Cajun |
| Minimum | $18,351 | $16,891 |
| Maximum | $55,513 | $46,697 |
| Range | $37,162 | $29,806 |
| Mean | $31,368 | $30,817 |
| Median | $31,841 | $29,870 |
| Interquartile 25% (IQ1) | $23,631 | $26,822 |
| Interquartile 75% (IQ3) | $38,333 | $35,445 |
| Interquartile Range (IQR) | $14,702 | $8,623 |
| Standard Deviation (Sample) | $8,445 | $6,316 |
| Standard Deviation (Population) | $8,394 | $6,279 |
Demographics Similar to Immigrants from Dominican Republic and Cajuns by Per Capita Income
In terms of per capita income, the demographic groups most similar to Immigrants from Dominican Republic are Indonesian ($37,300, a difference of 0.020%), Haitian ($37,289, a difference of 0.040%), Immigrants from Caribbean ($37,254, a difference of 0.14%), Cuban ($37,383, a difference of 0.21%), and Mexican American Indian ($37,407, a difference of 0.27%). Similarly, the demographic groups most similar to Cajuns are Immigrants from Guatemala ($37,550, a difference of 0.060%), U.S. Virgin Islander ($37,589, a difference of 0.16%), Immigrants from Micronesia ($37,464, a difference of 0.17%), Mexican American Indian ($37,407, a difference of 0.32%), and Cuban ($37,383, a difference of 0.39%).
| Demographics | Rating | Rank | Per Capita Income |
| Pennsylvania Germans | 0.1 /100 | #283 | Tragic $37,842 |
| Africans | 0.1 /100 | #284 | Tragic $37,785 |
| Guatemalans | 0.1 /100 | #285 | Tragic $37,766 |
| Central American Indians | 0.1 /100 | #286 | Tragic $37,699 |
| Dominicans | 0.1 /100 | #287 | Tragic $37,697 |
| Blackfeet | 0.1 /100 | #288 | Tragic $37,695 |
| U.S. Virgin Islanders | 0.1 /100 | #289 | Tragic $37,589 |
| Immigrants | Guatemala | 0.1 /100 | #290 | Tragic $37,550 |
| Cajuns | 0.1 /100 | #291 | Tragic $37,527 |
| Immigrants | Micronesia | 0.1 /100 | #292 | Tragic $37,464 |
| Mexican American Indians | 0.1 /100 | #293 | Tragic $37,407 |
| Cubans | 0.1 /100 | #294 | Tragic $37,383 |
| Immigrants | Dominican Republic | 0.1 /100 | #295 | Tragic $37,306 |
| Indonesians | 0.1 /100 | #296 | Tragic $37,300 |
| Haitians | 0.1 /100 | #297 | Tragic $37,289 |
| Immigrants | Caribbean | 0.1 /100 | #298 | Tragic $37,254 |
| Cherokee | 0.1 /100 | #299 | Tragic $37,203 |
| Immigrants | Bahamas | 0.1 /100 | #300 | Tragic $37,193 |
| Ottawa | 0.1 /100 | #301 | Tragic $37,101 |
| Shoshone | 0.1 /100 | #302 | Tragic $37,072 |
| Paiute | 0.1 /100 | #303 | Tragic $37,066 |