Nonimmigrants vs British West Indian Median Family Income
COMPARE
Nonimmigrants
British West Indian
Median Family Income
Median Family Income Comparison
Nonimmigrants
British West Indians
$96,231
MEDIAN FAMILY INCOME
3.6/ 100
METRIC RATING
224th/ 347
METRIC RANK
$88,987
MEDIAN FAMILY INCOME
0.1/ 100
METRIC RATING
280th/ 347
METRIC RANK
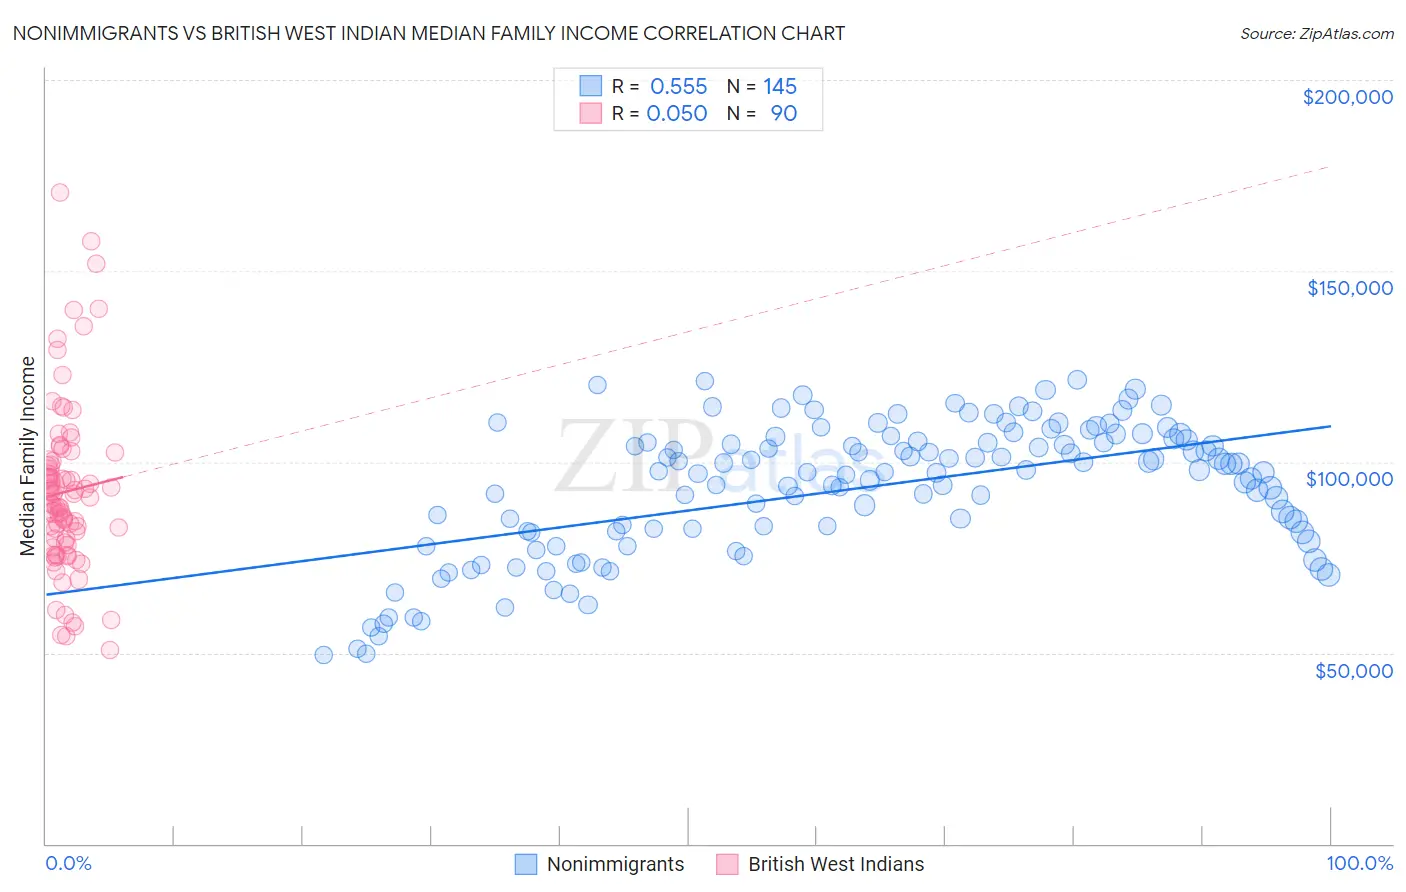
Nonimmigrants vs British West Indian Median Family Income Correlation Chart
The statistical analysis conducted on geographies consisting of 582,429,666 people shows a substantial positive correlation between the proportion of Nonimmigrants and median family income in the United States with a correlation coefficient (R) of 0.555 and weighted average of $96,231. Similarly, the statistical analysis conducted on geographies consisting of 152,609,449 people shows no correlation between the proportion of British West Indians and median family income in the United States with a correlation coefficient (R) of 0.050 and weighted average of $88,987, a difference of 8.1%.
Median Family Income Correlation Summary
| Measurement | Nonimmigrants | British West Indian |
| Minimum | $49,547 | $50,788 |
| Maximum | $121,513 | $170,703 |
| Range | $71,966 | $119,915 |
| Mean | $93,127 | $92,168 |
| Median | $97,277 | $89,815 |
| Interquartile 25% (IQ1) | $81,657 | $78,814 |
| Interquartile 75% (IQ3) | $105,547 | $100,192 |
| Interquartile Range (IQR) | $23,890 | $21,378 |
| Standard Deviation (Sample) | $17,276 | $22,307 |
| Standard Deviation (Population) | $17,216 | $22,182 |
Similar Demographics by Median Family Income
Demographics Similar to Nonimmigrants by Median Family Income
In terms of median family income, the demographic groups most similar to Nonimmigrants are Venezuelan ($96,281, a difference of 0.050%), Vietnamese ($96,123, a difference of 0.11%), Immigrants from Nigeria ($96,439, a difference of 0.22%), Immigrants from Ghana ($96,544, a difference of 0.33%), and Sudanese ($96,783, a difference of 0.57%).
| Demographics | Rating | Rank | Median Family Income |
| Japanese | 6.0 /100 | #217 | Tragic $97,288 |
| Immigrants | Cambodia | 5.8 /100 | #218 | Tragic $97,222 |
| Delaware | 5.1 /100 | #219 | Tragic $96,958 |
| Sudanese | 4.7 /100 | #220 | Tragic $96,783 |
| Immigrants | Ghana | 4.2 /100 | #221 | Tragic $96,544 |
| Immigrants | Nigeria | 4.0 /100 | #222 | Tragic $96,439 |
| Venezuelans | 3.7 /100 | #223 | Tragic $96,281 |
| Immigrants | Nonimmigrants | 3.6 /100 | #224 | Tragic $96,231 |
| Vietnamese | 3.4 /100 | #225 | Tragic $96,123 |
| Immigrants | Panama | 2.7 /100 | #226 | Tragic $95,647 |
| Alaska Natives | 2.6 /100 | #227 | Tragic $95,573 |
| Immigrants | Azores | 2.4 /100 | #228 | Tragic $95,402 |
| Marshallese | 2.2 /100 | #229 | Tragic $95,293 |
| Malaysians | 2.2 /100 | #230 | Tragic $95,230 |
| Ecuadorians | 2.1 /100 | #231 | Tragic $95,114 |
Demographics Similar to British West Indians by Median Family Income
In terms of median family income, the demographic groups most similar to British West Indians are Immigrants from Belize ($89,197, a difference of 0.24%), Immigrants from Grenada ($89,249, a difference of 0.29%), Blackfeet ($88,717, a difference of 0.30%), Immigrants from Jamaica ($89,268, a difference of 0.32%), and Immigrants from Zaire ($89,285, a difference of 0.33%).
| Demographics | Rating | Rank | Median Family Income |
| Immigrants | Micronesia | 0.2 /100 | #273 | Tragic $90,345 |
| Spanish Americans | 0.2 /100 | #274 | Tragic $90,322 |
| Immigrants | St. Vincent and the Grenadines | 0.2 /100 | #275 | Tragic $90,094 |
| Immigrants | Zaire | 0.1 /100 | #276 | Tragic $89,285 |
| Immigrants | Jamaica | 0.1 /100 | #277 | Tragic $89,268 |
| Immigrants | Grenada | 0.1 /100 | #278 | Tragic $89,249 |
| Immigrants | Belize | 0.1 /100 | #279 | Tragic $89,197 |
| British West Indians | 0.1 /100 | #280 | Tragic $88,987 |
| Blackfeet | 0.1 /100 | #281 | Tragic $88,717 |
| Comanche | 0.1 /100 | #282 | Tragic $88,556 |
| Bangladeshis | 0.1 /100 | #283 | Tragic $88,358 |
| Indonesians | 0.1 /100 | #284 | Tragic $88,301 |
| Guatemalans | 0.1 /100 | #285 | Tragic $88,295 |
| Immigrants | Nicaragua | 0.1 /100 | #286 | Tragic $88,267 |
| Potawatomi | 0.1 /100 | #287 | Tragic $88,265 |