Croatian vs Alaskan Athabascan Median Family Income
COMPARE
Croatian
Alaskan Athabascan
Median Family Income
Median Family Income Comparison
Croatians
Alaskan Athabascans
$111,370
MEDIAN FAMILY INCOME
98.8/ 100
METRIC RATING
85th/ 347
METRIC RANK
$94,429
MEDIAN FAMILY INCOME
1.5/ 100
METRIC RATING
237th/ 347
METRIC RANK
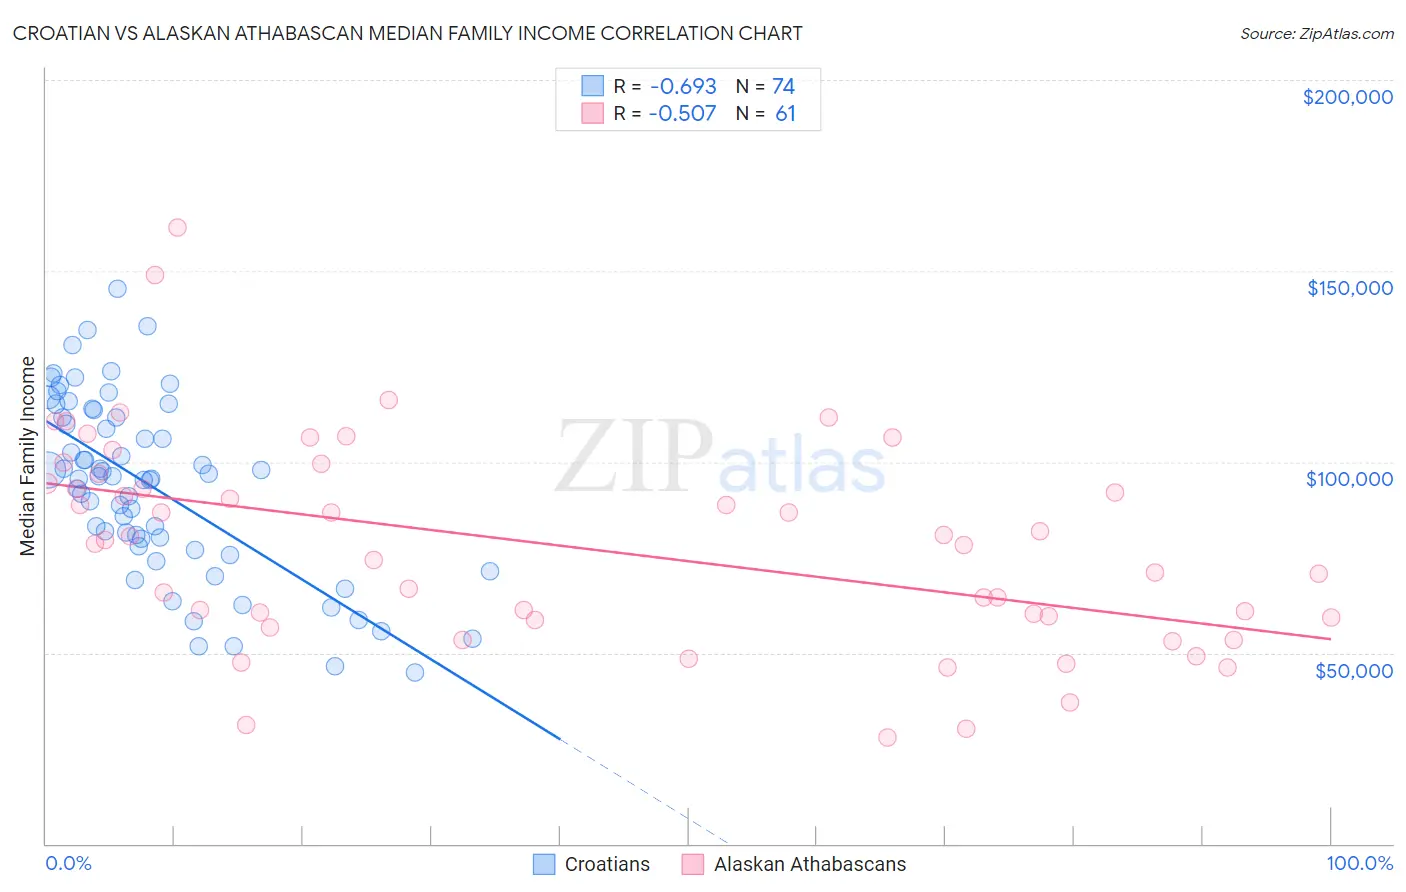
Croatian vs Alaskan Athabascan Median Family Income Correlation Chart
The statistical analysis conducted on geographies consisting of 375,427,421 people shows a significant negative correlation between the proportion of Croatians and median family income in the United States with a correlation coefficient (R) of -0.693 and weighted average of $111,370. Similarly, the statistical analysis conducted on geographies consisting of 45,809,380 people shows a substantial negative correlation between the proportion of Alaskan Athabascans and median family income in the United States with a correlation coefficient (R) of -0.507 and weighted average of $94,429, a difference of 17.9%.
Median Family Income Correlation Summary
| Measurement | Croatian | Alaskan Athabascan |
| Minimum | $44,806 | $27,750 |
| Maximum | $145,180 | $161,458 |
| Range | $100,374 | $133,708 |
| Mean | $93,423 | $77,954 |
| Median | $95,958 | $78,665 |
| Interquartile 25% (IQ1) | $78,056 | $58,765 |
| Interquartile 75% (IQ3) | $111,742 | $95,601 |
| Interquartile Range (IQR) | $33,686 | $36,836 |
| Standard Deviation (Sample) | $23,244 | $27,325 |
| Standard Deviation (Population) | $23,087 | $27,100 |
Similar Demographics by Median Family Income
Demographics Similar to Croatians by Median Family Income
In terms of median family income, the demographic groups most similar to Croatians are Ukrainian ($111,368, a difference of 0.0%), Immigrants from Hungary ($111,378, a difference of 0.010%), Austrian ($111,306, a difference of 0.060%), Romanian ($111,243, a difference of 0.11%), and Immigrants from Egypt ($111,689, a difference of 0.29%).
| Demographics | Rating | Rank | Median Family Income |
| Immigrants | Canada | 99.3 /100 | #78 | Exceptional $112,374 |
| Italians | 99.3 /100 | #79 | Exceptional $112,372 |
| Immigrants | Croatia | 99.3 /100 | #80 | Exceptional $112,323 |
| Immigrants | North America | 99.2 /100 | #81 | Exceptional $112,151 |
| Immigrants | England | 99.2 /100 | #82 | Exceptional $112,038 |
| Immigrants | Egypt | 99.0 /100 | #83 | Exceptional $111,689 |
| Immigrants | Hungary | 98.8 /100 | #84 | Exceptional $111,378 |
| Croatians | 98.8 /100 | #85 | Exceptional $111,370 |
| Ukrainians | 98.8 /100 | #86 | Exceptional $111,368 |
| Austrians | 98.8 /100 | #87 | Exceptional $111,306 |
| Romanians | 98.8 /100 | #88 | Exceptional $111,243 |
| Immigrants | Argentina | 98.5 /100 | #89 | Exceptional $110,873 |
| Northern Europeans | 98.3 /100 | #90 | Exceptional $110,635 |
| Immigrants | Southern Europe | 98.3 /100 | #91 | Exceptional $110,614 |
| Immigrants | Lebanon | 97.9 /100 | #92 | Exceptional $110,159 |
Demographics Similar to Alaskan Athabascans by Median Family Income
In terms of median family income, the demographic groups most similar to Alaskan Athabascans are Immigrants from Burma/Myanmar ($94,472, a difference of 0.040%), Trinidadian and Tobagonian ($94,466, a difference of 0.040%), Immigrants from Western Africa ($94,638, a difference of 0.22%), Immigrants from Bangladesh ($94,665, a difference of 0.25%), and Nepalese ($94,153, a difference of 0.29%).
| Demographics | Rating | Rank | Median Family Income |
| Malaysians | 2.2 /100 | #230 | Tragic $95,230 |
| Ecuadorians | 2.1 /100 | #231 | Tragic $95,114 |
| Immigrants | Venezuela | 1.9 /100 | #232 | Tragic $94,904 |
| Immigrants | Bangladesh | 1.6 /100 | #233 | Tragic $94,665 |
| Immigrants | Western Africa | 1.6 /100 | #234 | Tragic $94,638 |
| Immigrants | Burma/Myanmar | 1.5 /100 | #235 | Tragic $94,472 |
| Trinidadians and Tobagonians | 1.5 /100 | #236 | Tragic $94,466 |
| Alaskan Athabascans | 1.5 /100 | #237 | Tragic $94,429 |
| Nepalese | 1.3 /100 | #238 | Tragic $94,153 |
| Salvadorans | 1.2 /100 | #239 | Tragic $94,109 |
| Somalis | 1.2 /100 | #240 | Tragic $94,085 |
| Immigrants | Trinidad and Tobago | 1.2 /100 | #241 | Tragic $93,988 |
| Barbadians | 1.1 /100 | #242 | Tragic $93,919 |
| German Russians | 1.1 /100 | #243 | Tragic $93,858 |
| Sub-Saharan Africans | 1.0 /100 | #244 | Tragic $93,748 |