Greek vs British West Indian Median Family Income
COMPARE
Greek
British West Indian
Median Family Income
Median Family Income Comparison
Greeks
British West Indians
$115,192
MEDIAN FAMILY INCOME
99.8/ 100
METRIC RATING
57th/ 347
METRIC RANK
$88,987
MEDIAN FAMILY INCOME
0.1/ 100
METRIC RATING
280th/ 347
METRIC RANK
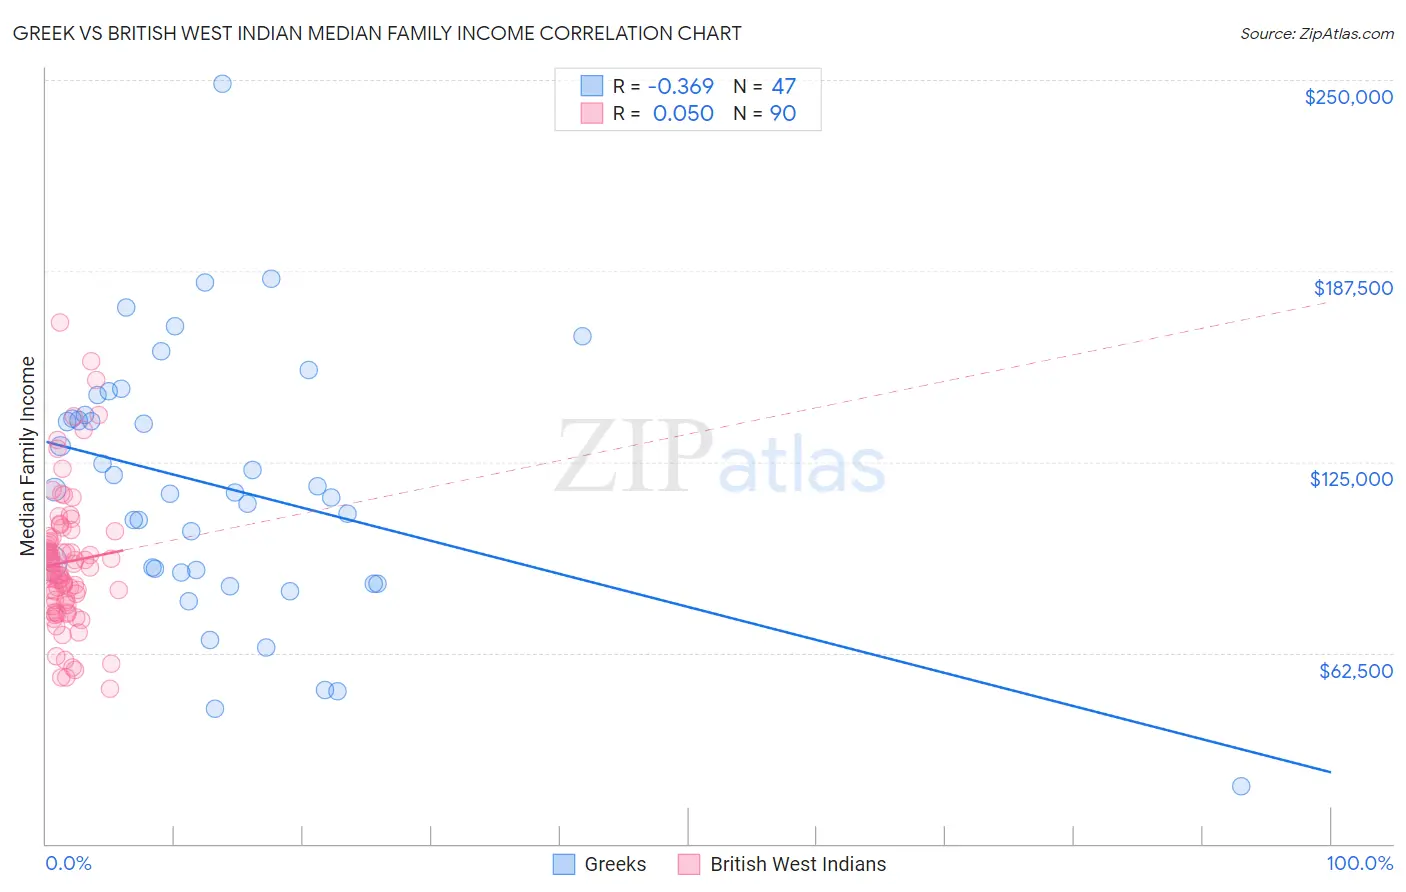
Greek vs British West Indian Median Family Income Correlation Chart
The statistical analysis conducted on geographies consisting of 482,131,670 people shows a mild negative correlation between the proportion of Greeks and median family income in the United States with a correlation coefficient (R) of -0.369 and weighted average of $115,192. Similarly, the statistical analysis conducted on geographies consisting of 152,609,449 people shows no correlation between the proportion of British West Indians and median family income in the United States with a correlation coefficient (R) of 0.050 and weighted average of $88,987, a difference of 29.4%.
Median Family Income Correlation Summary
| Measurement | Greek | British West Indian |
| Minimum | $18,825 | $50,788 |
| Maximum | $248,750 | $170,703 |
| Range | $229,925 | $119,915 |
| Mean | $116,811 | $92,168 |
| Median | $115,024 | $89,815 |
| Interquartile 25% (IQ1) | $88,890 | $78,814 |
| Interquartile 75% (IQ3) | $140,272 | $100,192 |
| Interquartile Range (IQR) | $51,382 | $21,378 |
| Standard Deviation (Sample) | $42,578 | $22,307 |
| Standard Deviation (Population) | $42,122 | $22,182 |
Similar Demographics by Median Family Income
Demographics Similar to Greeks by Median Family Income
In terms of median family income, the demographic groups most similar to Greeks are New Zealander ($115,230, a difference of 0.030%), Immigrants from Indonesia ($115,162, a difference of 0.030%), Lithuanian ($115,395, a difference of 0.18%), Immigrants from Netherlands ($114,987, a difference of 0.18%), and Immigrants from Europe ($115,523, a difference of 0.29%).
| Demographics | Rating | Rank | Median Family Income |
| Immigrants | Czechoslovakia | 99.9 /100 | #50 | Exceptional $116,165 |
| Immigrants | Malaysia | 99.9 /100 | #51 | Exceptional $115,880 |
| Maltese | 99.9 /100 | #52 | Exceptional $115,862 |
| Immigrants | Norway | 99.9 /100 | #53 | Exceptional $115,847 |
| Immigrants | Europe | 99.9 /100 | #54 | Exceptional $115,523 |
| Lithuanians | 99.8 /100 | #55 | Exceptional $115,395 |
| New Zealanders | 99.8 /100 | #56 | Exceptional $115,230 |
| Greeks | 99.8 /100 | #57 | Exceptional $115,192 |
| Immigrants | Indonesia | 99.8 /100 | #58 | Exceptional $115,162 |
| Immigrants | Netherlands | 99.8 /100 | #59 | Exceptional $114,987 |
| Immigrants | Latvia | 99.8 /100 | #60 | Exceptional $114,826 |
| Immigrants | Belarus | 99.8 /100 | #61 | Exceptional $114,586 |
| Mongolians | 99.8 /100 | #62 | Exceptional $114,553 |
| Immigrants | Pakistan | 99.8 /100 | #63 | Exceptional $114,406 |
| Immigrants | Scotland | 99.7 /100 | #64 | Exceptional $114,392 |
Demographics Similar to British West Indians by Median Family Income
In terms of median family income, the demographic groups most similar to British West Indians are Immigrants from Belize ($89,197, a difference of 0.24%), Immigrants from Grenada ($89,249, a difference of 0.29%), Blackfeet ($88,717, a difference of 0.30%), Immigrants from Jamaica ($89,268, a difference of 0.32%), and Immigrants from Zaire ($89,285, a difference of 0.33%).
| Demographics | Rating | Rank | Median Family Income |
| Immigrants | Micronesia | 0.2 /100 | #273 | Tragic $90,345 |
| Spanish Americans | 0.2 /100 | #274 | Tragic $90,322 |
| Immigrants | St. Vincent and the Grenadines | 0.2 /100 | #275 | Tragic $90,094 |
| Immigrants | Zaire | 0.1 /100 | #276 | Tragic $89,285 |
| Immigrants | Jamaica | 0.1 /100 | #277 | Tragic $89,268 |
| Immigrants | Grenada | 0.1 /100 | #278 | Tragic $89,249 |
| Immigrants | Belize | 0.1 /100 | #279 | Tragic $89,197 |
| British West Indians | 0.1 /100 | #280 | Tragic $88,987 |
| Blackfeet | 0.1 /100 | #281 | Tragic $88,717 |
| Comanche | 0.1 /100 | #282 | Tragic $88,556 |
| Bangladeshis | 0.1 /100 | #283 | Tragic $88,358 |
| Indonesians | 0.1 /100 | #284 | Tragic $88,301 |
| Guatemalans | 0.1 /100 | #285 | Tragic $88,295 |
| Immigrants | Nicaragua | 0.1 /100 | #286 | Tragic $88,267 |
| Potawatomi | 0.1 /100 | #287 | Tragic $88,265 |