Croatian vs South African Median Family Income
COMPARE
Croatian
South African
Median Family Income
Median Family Income Comparison
Croatians
South Africans
$111,370
MEDIAN FAMILY INCOME
98.8/ 100
METRIC RATING
85th/ 347
METRIC RANK
$113,229
MEDIAN FAMILY INCOME
99.5/ 100
METRIC RATING
71st/ 347
METRIC RANK
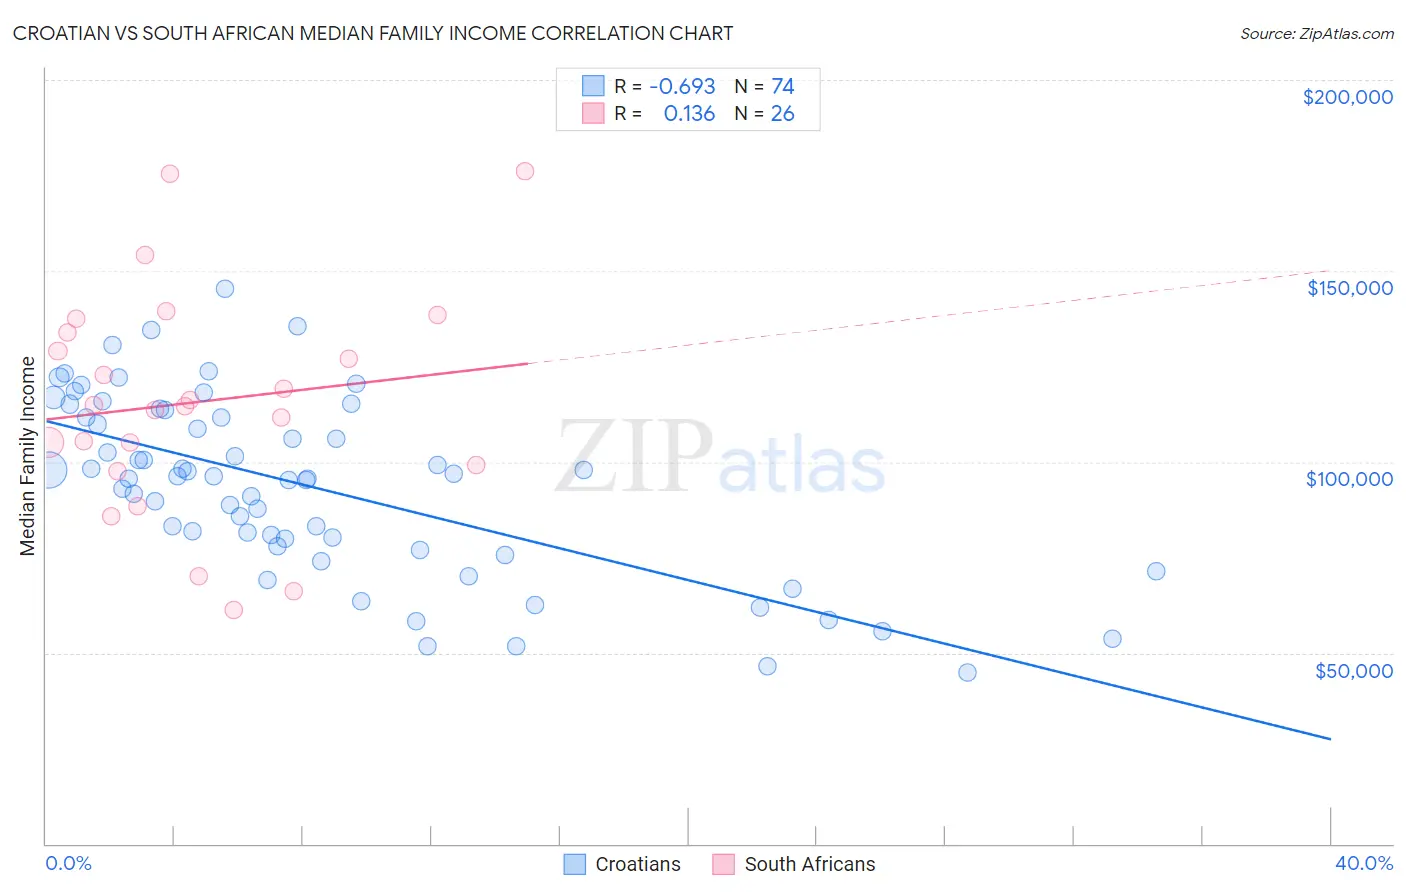
Croatian vs South African Median Family Income Correlation Chart
The statistical analysis conducted on geographies consisting of 375,427,421 people shows a significant negative correlation between the proportion of Croatians and median family income in the United States with a correlation coefficient (R) of -0.693 and weighted average of $111,370. Similarly, the statistical analysis conducted on geographies consisting of 182,514,560 people shows a poor positive correlation between the proportion of South Africans and median family income in the United States with a correlation coefficient (R) of 0.136 and weighted average of $113,229, a difference of 1.7%.
Median Family Income Correlation Summary
| Measurement | Croatian | South African |
| Minimum | $44,806 | $61,250 |
| Maximum | $145,180 | $176,195 |
| Range | $100,374 | $114,945 |
| Mean | $93,423 | $115,662 |
| Median | $95,958 | $114,722 |
| Interquartile 25% (IQ1) | $78,056 | $99,219 |
| Interquartile 75% (IQ3) | $111,742 | $133,864 |
| Interquartile Range (IQR) | $33,686 | $34,645 |
| Standard Deviation (Sample) | $23,244 | $29,017 |
| Standard Deviation (Population) | $23,087 | $28,454 |
Demographics Similar to Croatians and South Africans by Median Family Income
In terms of median family income, the demographic groups most similar to Croatians are Ukrainian ($111,368, a difference of 0.0%), Immigrants from Hungary ($111,378, a difference of 0.010%), Austrian ($111,306, a difference of 0.060%), Romanian ($111,243, a difference of 0.11%), and Immigrants from Egypt ($111,689, a difference of 0.29%). Similarly, the demographic groups most similar to South Africans are Immigrants from Romania ($113,434, a difference of 0.18%), Immigrants from Bulgaria ($113,461, a difference of 0.20%), Immigrants from Serbia ($113,463, a difference of 0.21%), Afghan ($112,971, a difference of 0.23%), and Laotian ($112,859, a difference of 0.33%).
| Demographics | Rating | Rank | Median Family Income |
| Immigrants | Serbia | 99.6 /100 | #68 | Exceptional $113,463 |
| Immigrants | Bulgaria | 99.6 /100 | #69 | Exceptional $113,461 |
| Immigrants | Romania | 99.6 /100 | #70 | Exceptional $113,434 |
| South Africans | 99.5 /100 | #71 | Exceptional $113,229 |
| Afghans | 99.5 /100 | #72 | Exceptional $112,971 |
| Laotians | 99.5 /100 | #73 | Exceptional $112,859 |
| Immigrants | Italy | 99.4 /100 | #74 | Exceptional $112,848 |
| Immigrants | Western Europe | 99.4 /100 | #75 | Exceptional $112,688 |
| Argentineans | 99.4 /100 | #76 | Exceptional $112,665 |
| Immigrants | Eastern Europe | 99.4 /100 | #77 | Exceptional $112,527 |
| Immigrants | Canada | 99.3 /100 | #78 | Exceptional $112,374 |
| Italians | 99.3 /100 | #79 | Exceptional $112,372 |
| Immigrants | Croatia | 99.3 /100 | #80 | Exceptional $112,323 |
| Immigrants | North America | 99.2 /100 | #81 | Exceptional $112,151 |
| Immigrants | England | 99.2 /100 | #82 | Exceptional $112,038 |
| Immigrants | Egypt | 99.0 /100 | #83 | Exceptional $111,689 |
| Immigrants | Hungary | 98.8 /100 | #84 | Exceptional $111,378 |
| Croatians | 98.8 /100 | #85 | Exceptional $111,370 |
| Ukrainians | 98.8 /100 | #86 | Exceptional $111,368 |
| Austrians | 98.8 /100 | #87 | Exceptional $111,306 |
| Romanians | 98.8 /100 | #88 | Exceptional $111,243 |