Ethiopian vs British West Indian Median Family Income
COMPARE
Ethiopian
British West Indian
Median Family Income
Median Family Income Comparison
Ethiopians
British West Indians
$108,251
MEDIAN FAMILY INCOME
94.5/ 100
METRIC RATING
118th/ 347
METRIC RANK
$88,987
MEDIAN FAMILY INCOME
0.1/ 100
METRIC RATING
280th/ 347
METRIC RANK
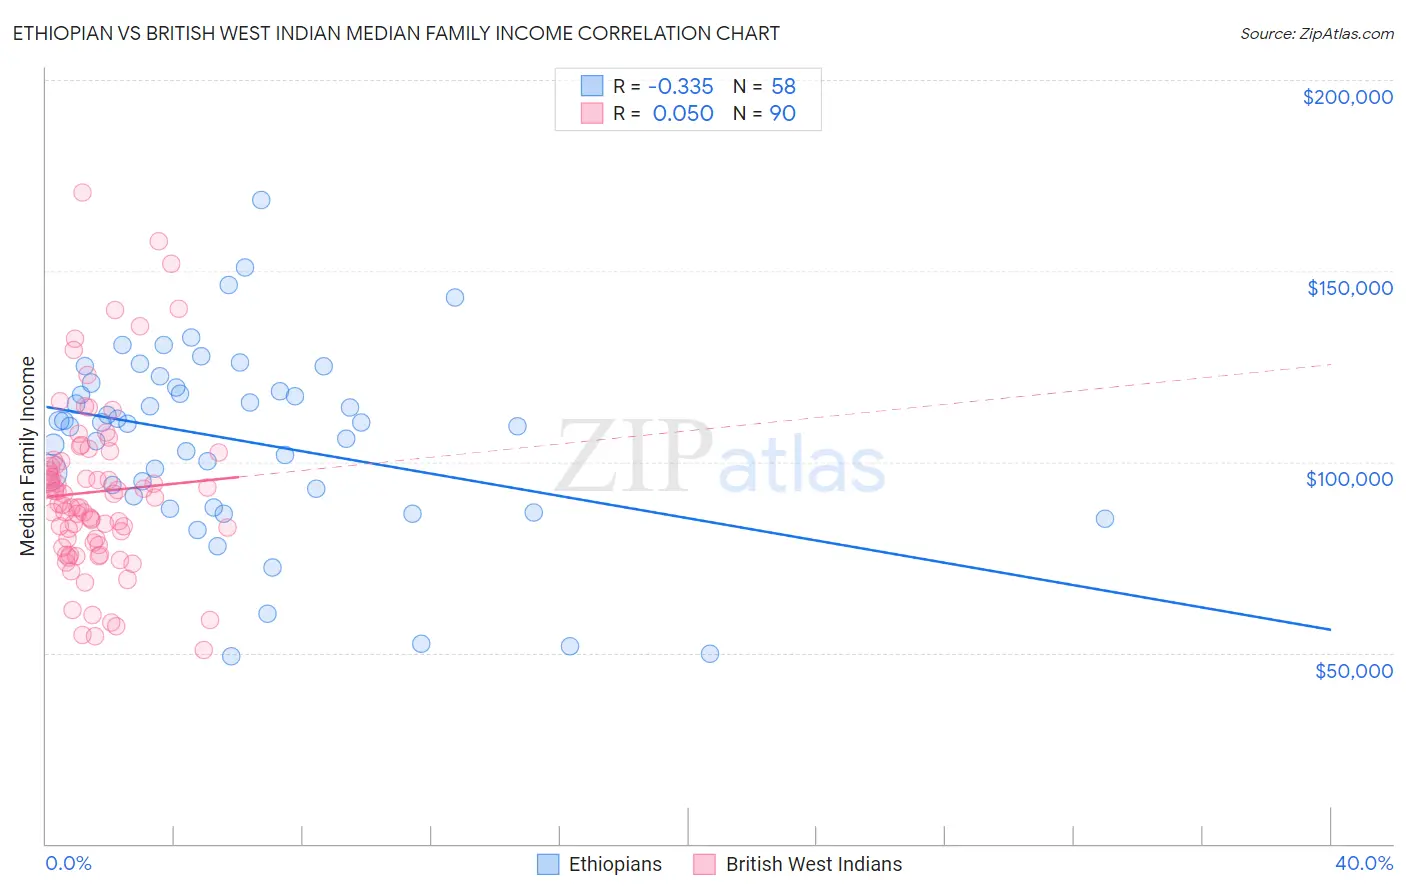
Ethiopian vs British West Indian Median Family Income Correlation Chart
The statistical analysis conducted on geographies consisting of 223,032,575 people shows a mild negative correlation between the proportion of Ethiopians and median family income in the United States with a correlation coefficient (R) of -0.335 and weighted average of $108,251. Similarly, the statistical analysis conducted on geographies consisting of 152,609,449 people shows no correlation between the proportion of British West Indians and median family income in the United States with a correlation coefficient (R) of 0.050 and weighted average of $88,987, a difference of 21.6%.
Median Family Income Correlation Summary
| Measurement | Ethiopian | British West Indian |
| Minimum | $48,964 | $50,788 |
| Maximum | $168,594 | $170,703 |
| Range | $119,630 | $119,915 |
| Mean | $105,611 | $92,168 |
| Median | $110,185 | $89,815 |
| Interquartile 25% (IQ1) | $91,124 | $78,814 |
| Interquartile 75% (IQ3) | $119,625 | $100,192 |
| Interquartile Range (IQR) | $28,501 | $21,378 |
| Standard Deviation (Sample) | $24,590 | $22,307 |
| Standard Deviation (Population) | $24,377 | $22,182 |
Similar Demographics by Median Family Income
Demographics Similar to Ethiopians by Median Family Income
In terms of median family income, the demographic groups most similar to Ethiopians are Sri Lankan ($108,234, a difference of 0.020%), Immigrants from Philippines ($108,288, a difference of 0.030%), Immigrants from Northern Africa ($108,161, a difference of 0.080%), European ($108,099, a difference of 0.14%), and Chilean ($108,429, a difference of 0.16%).
| Demographics | Rating | Rank | Median Family Income |
| Immigrants | Western Asia | 95.6 /100 | #111 | Exceptional $108,691 |
| Immigrants | Poland | 95.3 /100 | #112 | Exceptional $108,570 |
| Immigrants | Saudi Arabia | 95.2 /100 | #113 | Exceptional $108,544 |
| Poles | 95.2 /100 | #114 | Exceptional $108,507 |
| Swedes | 95.1 /100 | #115 | Exceptional $108,499 |
| Chileans | 95.0 /100 | #116 | Exceptional $108,429 |
| Immigrants | Philippines | 94.6 /100 | #117 | Exceptional $108,288 |
| Ethiopians | 94.5 /100 | #118 | Exceptional $108,251 |
| Sri Lankans | 94.5 /100 | #119 | Exceptional $108,234 |
| Immigrants | Northern Africa | 94.3 /100 | #120 | Exceptional $108,161 |
| Europeans | 94.1 /100 | #121 | Exceptional $108,099 |
| Immigrants | Jordan | 92.9 /100 | #122 | Exceptional $107,715 |
| Carpatho Rusyns | 92.2 /100 | #123 | Exceptional $107,502 |
| Pakistanis | 91.7 /100 | #124 | Exceptional $107,390 |
| Taiwanese | 91.4 /100 | #125 | Exceptional $107,295 |
Demographics Similar to British West Indians by Median Family Income
In terms of median family income, the demographic groups most similar to British West Indians are Immigrants from Belize ($89,197, a difference of 0.24%), Immigrants from Grenada ($89,249, a difference of 0.29%), Blackfeet ($88,717, a difference of 0.30%), Immigrants from Jamaica ($89,268, a difference of 0.32%), and Immigrants from Zaire ($89,285, a difference of 0.33%).
| Demographics | Rating | Rank | Median Family Income |
| Immigrants | Micronesia | 0.2 /100 | #273 | Tragic $90,345 |
| Spanish Americans | 0.2 /100 | #274 | Tragic $90,322 |
| Immigrants | St. Vincent and the Grenadines | 0.2 /100 | #275 | Tragic $90,094 |
| Immigrants | Zaire | 0.1 /100 | #276 | Tragic $89,285 |
| Immigrants | Jamaica | 0.1 /100 | #277 | Tragic $89,268 |
| Immigrants | Grenada | 0.1 /100 | #278 | Tragic $89,249 |
| Immigrants | Belize | 0.1 /100 | #279 | Tragic $89,197 |
| British West Indians | 0.1 /100 | #280 | Tragic $88,987 |
| Blackfeet | 0.1 /100 | #281 | Tragic $88,717 |
| Comanche | 0.1 /100 | #282 | Tragic $88,556 |
| Bangladeshis | 0.1 /100 | #283 | Tragic $88,358 |
| Indonesians | 0.1 /100 | #284 | Tragic $88,301 |
| Guatemalans | 0.1 /100 | #285 | Tragic $88,295 |
| Immigrants | Nicaragua | 0.1 /100 | #286 | Tragic $88,267 |
| Potawatomi | 0.1 /100 | #287 | Tragic $88,265 |