Croatian vs Immigrants from Thailand Median Family Income
COMPARE
Croatian
Immigrants from Thailand
Median Family Income
Median Family Income Comparison
Croatians
Immigrants from Thailand
$111,370
MEDIAN FAMILY INCOME
98.8/ 100
METRIC RATING
85th/ 347
METRIC RANK
$99,840
MEDIAN FAMILY INCOME
19.0/ 100
METRIC RATING
201st/ 347
METRIC RANK
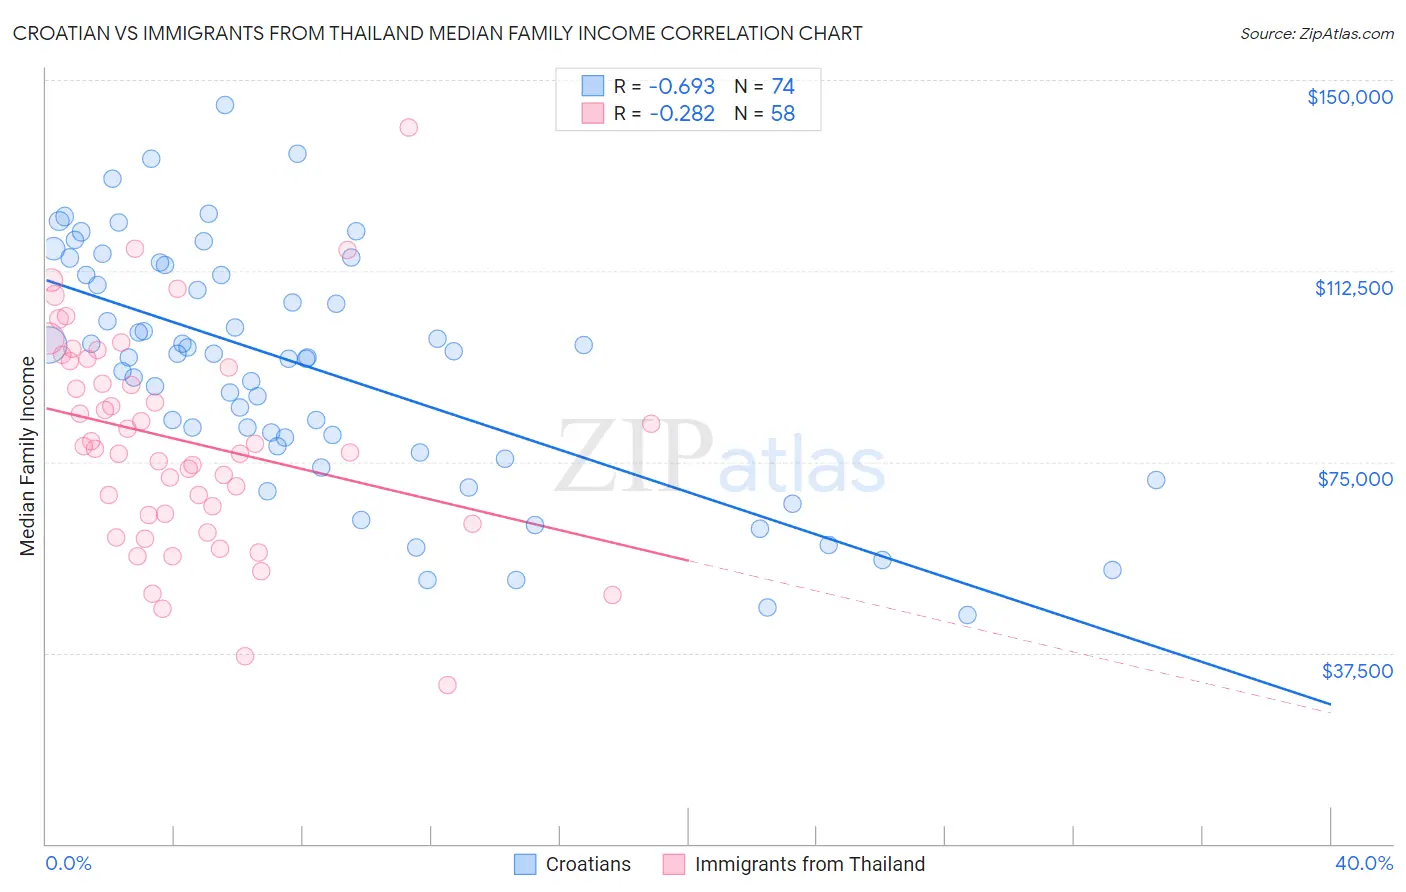
Croatian vs Immigrants from Thailand Median Family Income Correlation Chart
The statistical analysis conducted on geographies consisting of 375,427,421 people shows a significant negative correlation between the proportion of Croatians and median family income in the United States with a correlation coefficient (R) of -0.693 and weighted average of $111,370. Similarly, the statistical analysis conducted on geographies consisting of 316,887,320 people shows a weak negative correlation between the proportion of Immigrants from Thailand and median family income in the United States with a correlation coefficient (R) of -0.282 and weighted average of $99,840, a difference of 11.6%.
Median Family Income Correlation Summary
| Measurement | Croatian | Immigrants from Thailand |
| Minimum | $44,806 | $31,250 |
| Maximum | $145,180 | $140,711 |
| Range | $100,374 | $109,461 |
| Mean | $93,423 | $79,142 |
| Median | $95,958 | $77,801 |
| Interquartile 25% (IQ1) | $78,056 | $64,533 |
| Interquartile 75% (IQ3) | $111,742 | $94,707 |
| Interquartile Range (IQR) | $33,686 | $30,174 |
| Standard Deviation (Sample) | $23,244 | $21,144 |
| Standard Deviation (Population) | $23,087 | $20,961 |
Similar Demographics by Median Family Income
Demographics Similar to Croatians by Median Family Income
In terms of median family income, the demographic groups most similar to Croatians are Ukrainian ($111,368, a difference of 0.0%), Immigrants from Hungary ($111,378, a difference of 0.010%), Austrian ($111,306, a difference of 0.060%), Romanian ($111,243, a difference of 0.11%), and Immigrants from Egypt ($111,689, a difference of 0.29%).
| Demographics | Rating | Rank | Median Family Income |
| Immigrants | Canada | 99.3 /100 | #78 | Exceptional $112,374 |
| Italians | 99.3 /100 | #79 | Exceptional $112,372 |
| Immigrants | Croatia | 99.3 /100 | #80 | Exceptional $112,323 |
| Immigrants | North America | 99.2 /100 | #81 | Exceptional $112,151 |
| Immigrants | England | 99.2 /100 | #82 | Exceptional $112,038 |
| Immigrants | Egypt | 99.0 /100 | #83 | Exceptional $111,689 |
| Immigrants | Hungary | 98.8 /100 | #84 | Exceptional $111,378 |
| Croatians | 98.8 /100 | #85 | Exceptional $111,370 |
| Ukrainians | 98.8 /100 | #86 | Exceptional $111,368 |
| Austrians | 98.8 /100 | #87 | Exceptional $111,306 |
| Romanians | 98.8 /100 | #88 | Exceptional $111,243 |
| Immigrants | Argentina | 98.5 /100 | #89 | Exceptional $110,873 |
| Northern Europeans | 98.3 /100 | #90 | Exceptional $110,635 |
| Immigrants | Southern Europe | 98.3 /100 | #91 | Exceptional $110,614 |
| Immigrants | Lebanon | 97.9 /100 | #92 | Exceptional $110,159 |
Demographics Similar to Immigrants from Thailand by Median Family Income
In terms of median family income, the demographic groups most similar to Immigrants from Thailand are White/Caucasian ($99,800, a difference of 0.040%), Spanish ($99,977, a difference of 0.14%), Scotch-Irish ($99,591, a difference of 0.25%), Yugoslavian ($100,119, a difference of 0.28%), and Immigrants from Africa ($100,256, a difference of 0.42%).
| Demographics | Rating | Rank | Median Family Income |
| Uruguayans | 26.3 /100 | #194 | Fair $100,656 |
| Immigrants | South America | 23.9 /100 | #195 | Fair $100,414 |
| Samoans | 23.3 /100 | #196 | Fair $100,344 |
| Immigrants | Cameroon | 22.8 /100 | #197 | Fair $100,289 |
| Immigrants | Africa | 22.5 /100 | #198 | Fair $100,256 |
| Yugoslavians | 21.3 /100 | #199 | Fair $100,119 |
| Spanish | 20.1 /100 | #200 | Fair $99,977 |
| Immigrants | Thailand | 19.0 /100 | #201 | Poor $99,840 |
| Whites/Caucasians | 18.7 /100 | #202 | Poor $99,800 |
| Scotch-Irish | 17.1 /100 | #203 | Poor $99,591 |
| Ghanaians | 12.6 /100 | #204 | Poor $98,877 |
| Hawaiians | 12.5 /100 | #205 | Poor $98,869 |
| Immigrants | Iraq | 12.1 /100 | #206 | Poor $98,786 |
| Aleuts | 11.6 /100 | #207 | Poor $98,702 |
| Immigrants | Uruguay | 9.2 /100 | #208 | Tragic $98,205 |