Indonesian vs British West Indian Median Family Income
COMPARE
Indonesian
British West Indian
Median Family Income
Median Family Income Comparison
Indonesians
British West Indians
$88,301
MEDIAN FAMILY INCOME
0.1/ 100
METRIC RATING
284th/ 347
METRIC RANK
$88,987
MEDIAN FAMILY INCOME
0.1/ 100
METRIC RATING
280th/ 347
METRIC RANK
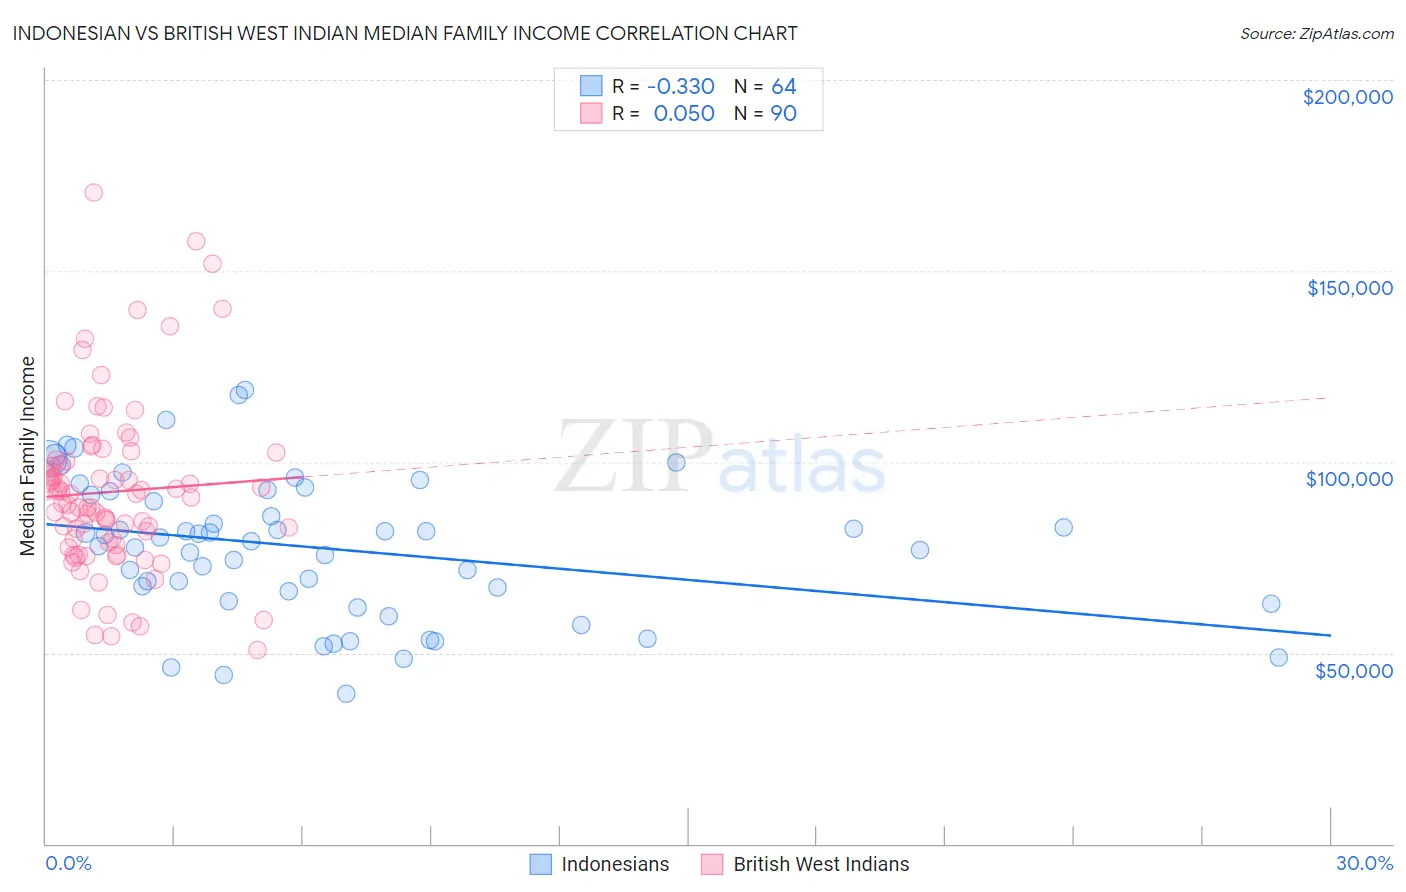
Indonesian vs British West Indian Median Family Income Correlation Chart
The statistical analysis conducted on geographies consisting of 162,594,892 people shows a mild negative correlation between the proportion of Indonesians and median family income in the United States with a correlation coefficient (R) of -0.330 and weighted average of $88,301. Similarly, the statistical analysis conducted on geographies consisting of 152,609,449 people shows no correlation between the proportion of British West Indians and median family income in the United States with a correlation coefficient (R) of 0.050 and weighted average of $88,987, a difference of 0.78%.
Median Family Income Correlation Summary
| Measurement | Indonesian | British West Indian |
| Minimum | $39,136 | $50,788 |
| Maximum | $118,875 | $170,703 |
| Range | $79,739 | $119,915 |
| Mean | $77,501 | $92,168 |
| Median | $79,746 | $89,815 |
| Interquartile 25% (IQ1) | $64,843 | $78,814 |
| Interquartile 75% (IQ3) | $91,846 | $100,192 |
| Interquartile Range (IQR) | $27,003 | $21,378 |
| Standard Deviation (Sample) | $18,499 | $22,307 |
| Standard Deviation (Population) | $18,353 | $22,182 |
Demographics Similar to Indonesians and British West Indians by Median Family Income
In terms of median family income, the demographic groups most similar to Indonesians are Guatemalan ($88,295, a difference of 0.010%), Immigrants from Nicaragua ($88,267, a difference of 0.040%), Potawatomi ($88,265, a difference of 0.040%), Bangladeshi ($88,358, a difference of 0.060%), and Cherokee ($88,209, a difference of 0.10%). Similarly, the demographic groups most similar to British West Indians are Immigrants from Belize ($89,197, a difference of 0.24%), Immigrants from Grenada ($89,249, a difference of 0.29%), Blackfeet ($88,717, a difference of 0.30%), Immigrants from Jamaica ($89,268, a difference of 0.32%), and Immigrants from Zaire ($89,285, a difference of 0.33%).
| Demographics | Rating | Rank | Median Family Income |
| Immigrants | Liberia | 0.2 /100 | #272 | Tragic $90,450 |
| Immigrants | Micronesia | 0.2 /100 | #273 | Tragic $90,345 |
| Spanish Americans | 0.2 /100 | #274 | Tragic $90,322 |
| Immigrants | St. Vincent and the Grenadines | 0.2 /100 | #275 | Tragic $90,094 |
| Immigrants | Zaire | 0.1 /100 | #276 | Tragic $89,285 |
| Immigrants | Jamaica | 0.1 /100 | #277 | Tragic $89,268 |
| Immigrants | Grenada | 0.1 /100 | #278 | Tragic $89,249 |
| Immigrants | Belize | 0.1 /100 | #279 | Tragic $89,197 |
| British West Indians | 0.1 /100 | #280 | Tragic $88,987 |
| Blackfeet | 0.1 /100 | #281 | Tragic $88,717 |
| Comanche | 0.1 /100 | #282 | Tragic $88,556 |
| Bangladeshis | 0.1 /100 | #283 | Tragic $88,358 |
| Indonesians | 0.1 /100 | #284 | Tragic $88,301 |
| Guatemalans | 0.1 /100 | #285 | Tragic $88,295 |
| Immigrants | Nicaragua | 0.1 /100 | #286 | Tragic $88,267 |
| Potawatomi | 0.1 /100 | #287 | Tragic $88,265 |
| Cherokee | 0.1 /100 | #288 | Tragic $88,209 |
| Central American Indians | 0.1 /100 | #289 | Tragic $88,034 |
| Shoshone | 0.1 /100 | #290 | Tragic $87,872 |
| Immigrants | Cabo Verde | 0.1 /100 | #291 | Tragic $87,830 |
| Africans | 0.1 /100 | #292 | Tragic $87,820 |