Bahamian vs Immigrants from Lithuania Median Female Earnings
COMPARE
Bahamian
Immigrants from Lithuania
Median Female Earnings
Median Female Earnings Comparison
Bahamians
Immigrants from Lithuania
$35,125
MEDIAN FEMALE EARNINGS
0.0/ 100
METRIC RATING
305th/ 347
METRIC RANK
$43,317
MEDIAN FEMALE EARNINGS
99.9/ 100
METRIC RATING
52nd/ 347
METRIC RANK
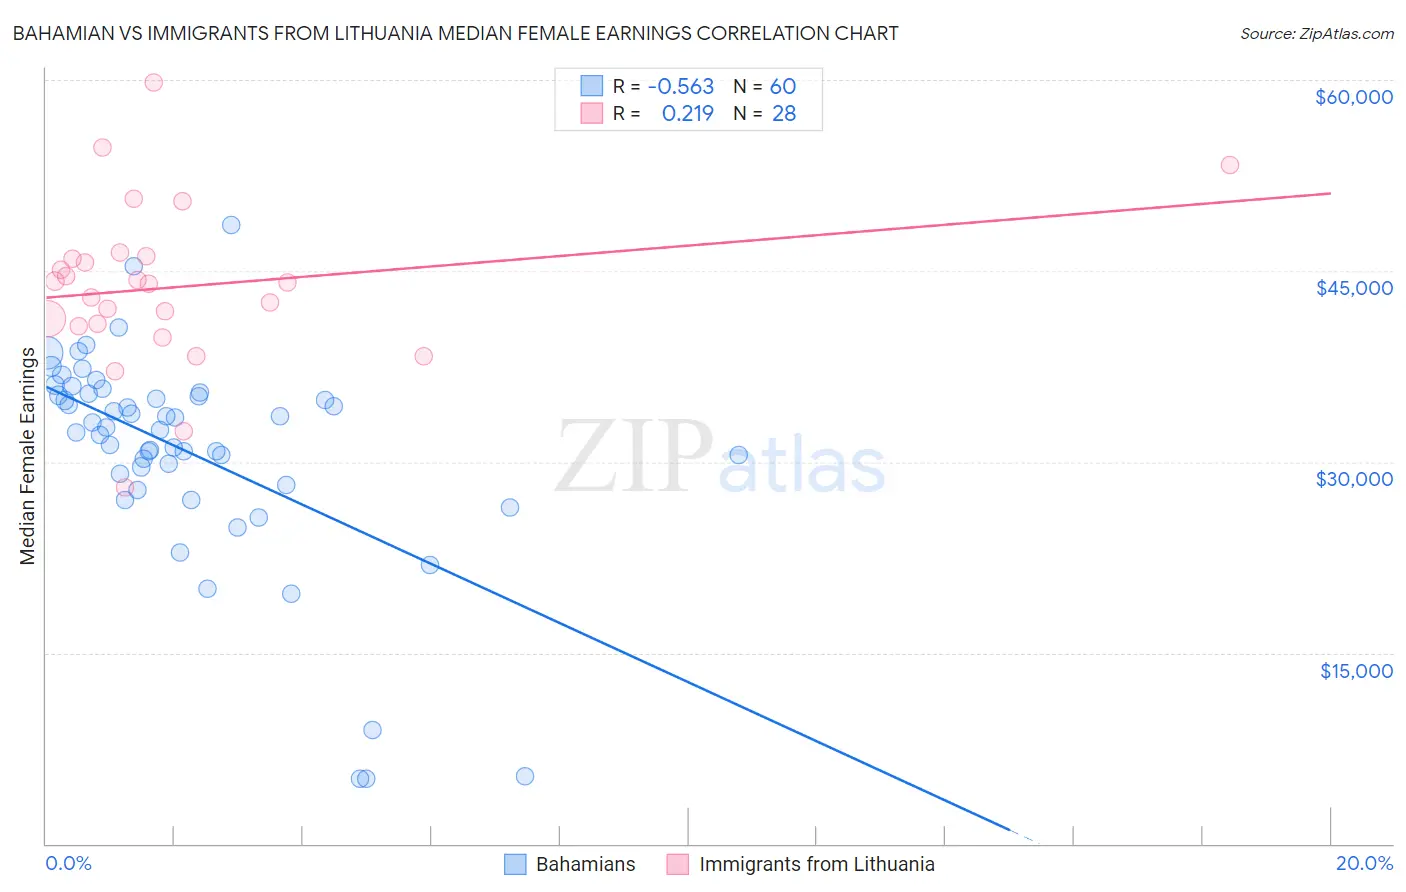
Bahamian vs Immigrants from Lithuania Median Female Earnings Correlation Chart
The statistical analysis conducted on geographies consisting of 112,672,199 people shows a substantial negative correlation between the proportion of Bahamians and median female earnings in the United States with a correlation coefficient (R) of -0.563 and weighted average of $35,125. Similarly, the statistical analysis conducted on geographies consisting of 117,702,564 people shows a weak positive correlation between the proportion of Immigrants from Lithuania and median female earnings in the United States with a correlation coefficient (R) of 0.219 and weighted average of $43,317, a difference of 23.3%.
Median Female Earnings Correlation Summary
| Measurement | Bahamian | Immigrants from Lithuania |
| Minimum | $5,063 | $27,947 |
| Maximum | $48,590 | $59,782 |
| Range | $43,527 | $31,835 |
| Mean | $30,808 | $43,754 |
| Median | $32,617 | $44,042 |
| Interquartile 25% (IQ1) | $28,645 | $40,753 |
| Interquartile 75% (IQ3) | $35,290 | $46,071 |
| Interquartile Range (IQR) | $6,645 | $5,319 |
| Standard Deviation (Sample) | $8,476 | $6,428 |
| Standard Deviation (Population) | $8,405 | $6,312 |
Similar Demographics by Median Female Earnings
Demographics Similar to Bahamians by Median Female Earnings
In terms of median female earnings, the demographic groups most similar to Bahamians are Fijian ($35,114, a difference of 0.030%), Sioux ($35,063, a difference of 0.18%), Immigrants from Bahamas ($35,027, a difference of 0.28%), Honduran ($35,013, a difference of 0.32%), and Chippewa ($35,003, a difference of 0.35%).
| Demographics | Rating | Rank | Median Female Earnings |
| Immigrants | Micronesia | 0.0 /100 | #298 | Tragic $35,477 |
| Immigrants | Guatemala | 0.0 /100 | #299 | Tragic $35,444 |
| Yuman | 0.0 /100 | #300 | Tragic $35,377 |
| Pima | 0.0 /100 | #301 | Tragic $35,326 |
| Blacks/African Americans | 0.0 /100 | #302 | Tragic $35,315 |
| Immigrants | Latin America | 0.0 /100 | #303 | Tragic $35,307 |
| Crow | 0.0 /100 | #304 | Tragic $35,266 |
| Bahamians | 0.0 /100 | #305 | Tragic $35,125 |
| Fijians | 0.0 /100 | #306 | Tragic $35,114 |
| Sioux | 0.0 /100 | #307 | Tragic $35,063 |
| Immigrants | Bahamas | 0.0 /100 | #308 | Tragic $35,027 |
| Hondurans | 0.0 /100 | #309 | Tragic $35,013 |
| Chippewa | 0.0 /100 | #310 | Tragic $35,003 |
| Ute | 0.0 /100 | #311 | Tragic $34,960 |
| Yaqui | 0.0 /100 | #312 | Tragic $34,943 |
Demographics Similar to Immigrants from Lithuania by Median Female Earnings
In terms of median female earnings, the demographic groups most similar to Immigrants from Lithuania are Immigrants from Eastern Europe ($43,309, a difference of 0.020%), Australian ($43,308, a difference of 0.020%), Egyptian ($43,305, a difference of 0.030%), Maltese ($43,357, a difference of 0.090%), and Immigrants from Uzbekistan ($43,363, a difference of 0.11%).
| Demographics | Rating | Rank | Median Female Earnings |
| Immigrants | Europe | 100.0 /100 | #45 | Exceptional $43,523 |
| Immigrants | Bolivia | 100.0 /100 | #46 | Exceptional $43,467 |
| Bolivians | 100.0 /100 | #47 | Exceptional $43,445 |
| Immigrants | Indonesia | 100.0 /100 | #48 | Exceptional $43,412 |
| Immigrants | Serbia | 100.0 /100 | #49 | Exceptional $43,385 |
| Immigrants | Uzbekistan | 100.0 /100 | #50 | Exceptional $43,363 |
| Maltese | 100.0 /100 | #51 | Exceptional $43,357 |
| Immigrants | Lithuania | 99.9 /100 | #52 | Exceptional $43,317 |
| Immigrants | Eastern Europe | 99.9 /100 | #53 | Exceptional $43,309 |
| Australians | 99.9 /100 | #54 | Exceptional $43,308 |
| Egyptians | 99.9 /100 | #55 | Exceptional $43,305 |
| Immigrants | Croatia | 99.9 /100 | #56 | Exceptional $43,258 |
| Ethiopians | 99.9 /100 | #57 | Exceptional $43,243 |
| Paraguayans | 99.9 /100 | #58 | Exceptional $43,173 |
| Estonians | 99.9 /100 | #59 | Exceptional $43,106 |