Cree vs Syrian Median Family Income
COMPARE
Cree
Syrian
Median Family Income
Median Family Income Comparison
Cree
Syrians
$90,882
MEDIAN FAMILY INCOME
0.2/ 100
METRIC RATING
268th/ 347
METRIC RANK
$109,299
MEDIAN FAMILY INCOME
96.7/ 100
METRIC RATING
105th/ 347
METRIC RANK
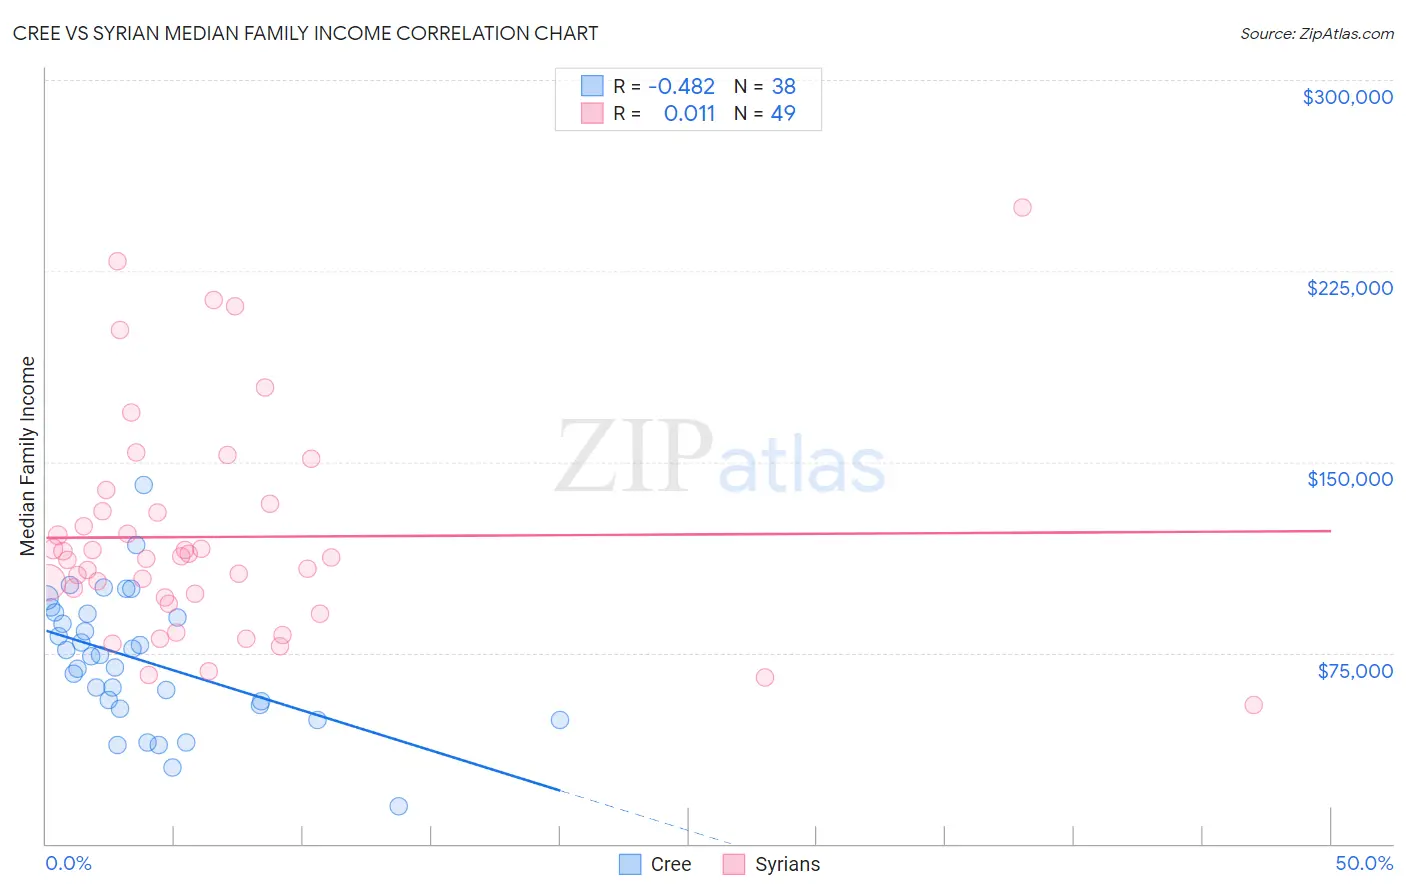
Cree vs Syrian Median Family Income Correlation Chart
The statistical analysis conducted on geographies consisting of 76,200,070 people shows a moderate negative correlation between the proportion of Cree and median family income in the United States with a correlation coefficient (R) of -0.482 and weighted average of $90,882. Similarly, the statistical analysis conducted on geographies consisting of 266,121,258 people shows no correlation between the proportion of Syrians and median family income in the United States with a correlation coefficient (R) of 0.011 and weighted average of $109,299, a difference of 20.3%.
Median Family Income Correlation Summary
| Measurement | Cree | Syrian |
| Minimum | $14,519 | $54,375 |
| Maximum | $140,987 | $250,001 |
| Range | $126,468 | $195,626 |
| Mean | $71,996 | $120,507 |
| Median | $73,827 | $112,639 |
| Interquartile 25% (IQ1) | $54,375 | $95,409 |
| Interquartile 75% (IQ3) | $90,158 | $132,003 |
| Interquartile Range (IQR) | $35,783 | $36,594 |
| Standard Deviation (Sample) | $25,840 | $43,231 |
| Standard Deviation (Population) | $25,498 | $42,788 |
Similar Demographics by Median Family Income
Demographics Similar to Cree by Median Family Income
In terms of median family income, the demographic groups most similar to Cree are Belizean ($90,880, a difference of 0.0%), Mexican American Indian ($90,918, a difference of 0.040%), Central American ($91,087, a difference of 0.23%), Jamaican ($90,581, a difference of 0.33%), and Iroquois ($90,543, a difference of 0.37%).
| Demographics | Rating | Rank | Median Family Income |
| Inupiat | 0.4 /100 | #261 | Tragic $91,730 |
| Liberians | 0.4 /100 | #262 | Tragic $91,722 |
| Immigrants | West Indies | 0.3 /100 | #263 | Tragic $91,588 |
| Senegalese | 0.3 /100 | #264 | Tragic $91,475 |
| Hmong | 0.3 /100 | #265 | Tragic $91,296 |
| Central Americans | 0.3 /100 | #266 | Tragic $91,087 |
| Mexican American Indians | 0.2 /100 | #267 | Tragic $90,918 |
| Cree | 0.2 /100 | #268 | Tragic $90,882 |
| Belizeans | 0.2 /100 | #269 | Tragic $90,880 |
| Jamaicans | 0.2 /100 | #270 | Tragic $90,581 |
| Iroquois | 0.2 /100 | #271 | Tragic $90,543 |
| Immigrants | Liberia | 0.2 /100 | #272 | Tragic $90,450 |
| Immigrants | Micronesia | 0.2 /100 | #273 | Tragic $90,345 |
| Spanish Americans | 0.2 /100 | #274 | Tragic $90,322 |
| Immigrants | St. Vincent and the Grenadines | 0.2 /100 | #275 | Tragic $90,094 |
Demographics Similar to Syrians by Median Family Income
In terms of median family income, the demographic groups most similar to Syrians are Palestinian ($109,413, a difference of 0.10%), Immigrants from Brazil ($109,418, a difference of 0.11%), Albanian ($109,136, a difference of 0.15%), Immigrants from North Macedonia ($109,136, a difference of 0.15%), and Assyrian/Chaldean/Syriac ($109,622, a difference of 0.30%).
| Demographics | Rating | Rank | Median Family Income |
| Immigrants | Kuwait | 97.4 /100 | #98 | Exceptional $109,731 |
| Armenians | 97.3 /100 | #99 | Exceptional $109,692 |
| Macedonians | 97.3 /100 | #100 | Exceptional $109,668 |
| Immigrants | Ukraine | 97.2 /100 | #101 | Exceptional $109,645 |
| Assyrians/Chaldeans/Syriacs | 97.2 /100 | #102 | Exceptional $109,622 |
| Immigrants | Brazil | 96.9 /100 | #103 | Exceptional $109,418 |
| Palestinians | 96.9 /100 | #104 | Exceptional $109,413 |
| Syrians | 96.7 /100 | #105 | Exceptional $109,299 |
| Albanians | 96.4 /100 | #106 | Exceptional $109,136 |
| Immigrants | North Macedonia | 96.4 /100 | #107 | Exceptional $109,136 |
| Immigrants | Zimbabwe | 95.9 /100 | #108 | Exceptional $108,830 |
| Immigrants | Afghanistan | 95.6 /100 | #109 | Exceptional $108,709 |
| British | 95.6 /100 | #110 | Exceptional $108,705 |
| Immigrants | Western Asia | 95.6 /100 | #111 | Exceptional $108,691 |
| Immigrants | Poland | 95.3 /100 | #112 | Exceptional $108,570 |