Cree vs Bermudan Median Family Income
COMPARE
Cree
Bermudan
Median Family Income
Median Family Income Comparison
Cree
Bermudans
$90,882
MEDIAN FAMILY INCOME
0.2/ 100
METRIC RATING
268th/ 347
METRIC RANK
$97,577
MEDIAN FAMILY INCOME
6.9/ 100
METRIC RATING
214th/ 347
METRIC RANK
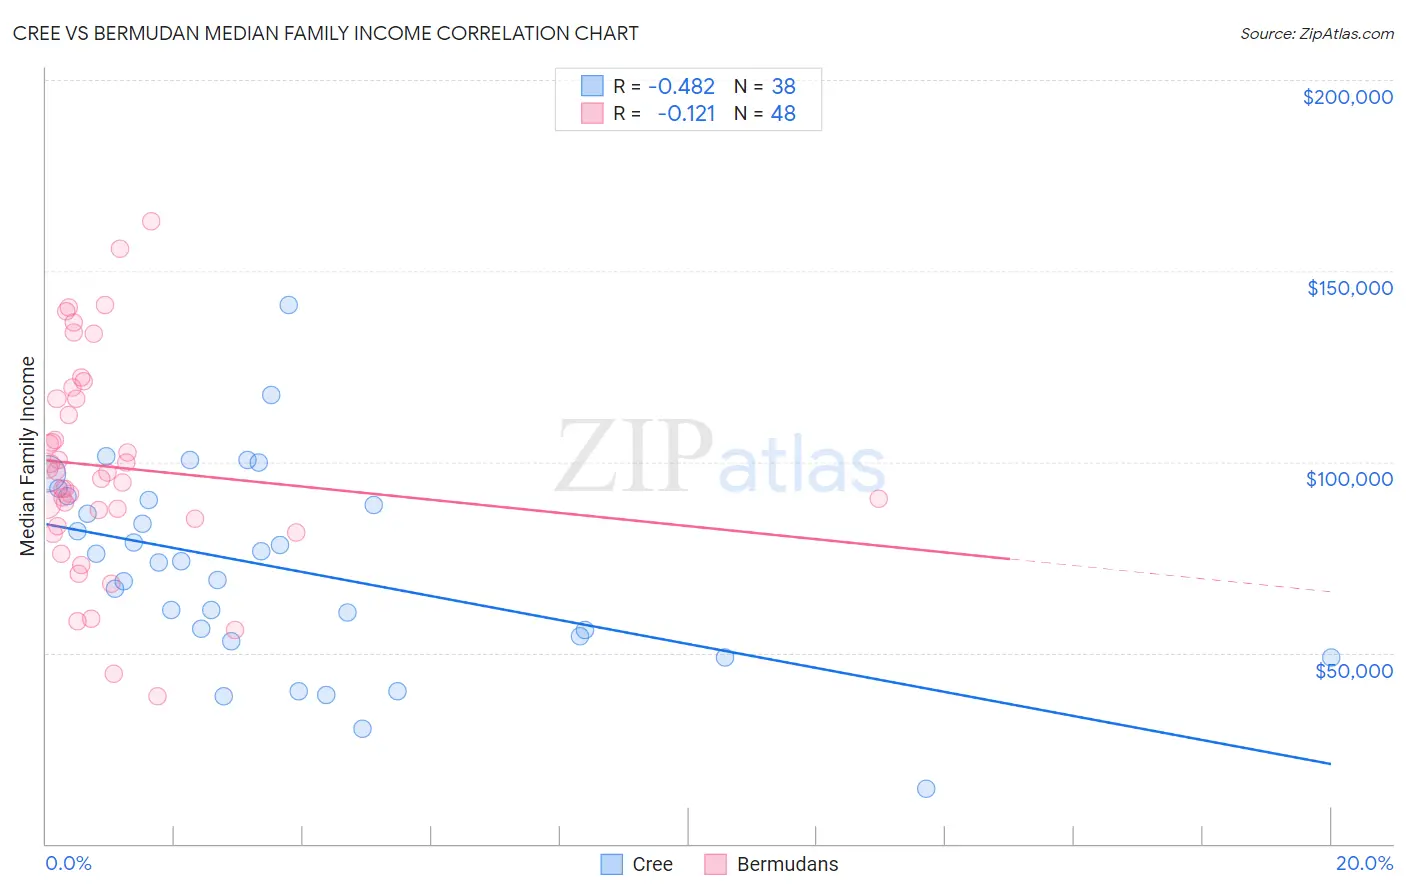
Cree vs Bermudan Median Family Income Correlation Chart
The statistical analysis conducted on geographies consisting of 76,200,070 people shows a moderate negative correlation between the proportion of Cree and median family income in the United States with a correlation coefficient (R) of -0.482 and weighted average of $90,882. Similarly, the statistical analysis conducted on geographies consisting of 55,709,060 people shows a poor negative correlation between the proportion of Bermudans and median family income in the United States with a correlation coefficient (R) of -0.121 and weighted average of $97,577, a difference of 7.4%.
Median Family Income Correlation Summary
| Measurement | Cree | Bermudan |
| Minimum | $14,519 | $38,750 |
| Maximum | $140,987 | $163,000 |
| Range | $126,468 | $124,250 |
| Mean | $71,996 | $98,727 |
| Median | $73,827 | $96,344 |
| Interquartile 25% (IQ1) | $54,375 | $84,141 |
| Interquartile 75% (IQ3) | $90,158 | $116,507 |
| Interquartile Range (IQR) | $35,783 | $32,365 |
| Standard Deviation (Sample) | $25,840 | $27,353 |
| Standard Deviation (Population) | $25,498 | $27,067 |
Similar Demographics by Median Family Income
Demographics Similar to Cree by Median Family Income
In terms of median family income, the demographic groups most similar to Cree are Belizean ($90,880, a difference of 0.0%), Mexican American Indian ($90,918, a difference of 0.040%), Central American ($91,087, a difference of 0.23%), Jamaican ($90,581, a difference of 0.33%), and Iroquois ($90,543, a difference of 0.37%).
| Demographics | Rating | Rank | Median Family Income |
| Inupiat | 0.4 /100 | #261 | Tragic $91,730 |
| Liberians | 0.4 /100 | #262 | Tragic $91,722 |
| Immigrants | West Indies | 0.3 /100 | #263 | Tragic $91,588 |
| Senegalese | 0.3 /100 | #264 | Tragic $91,475 |
| Hmong | 0.3 /100 | #265 | Tragic $91,296 |
| Central Americans | 0.3 /100 | #266 | Tragic $91,087 |
| Mexican American Indians | 0.2 /100 | #267 | Tragic $90,918 |
| Cree | 0.2 /100 | #268 | Tragic $90,882 |
| Belizeans | 0.2 /100 | #269 | Tragic $90,880 |
| Jamaicans | 0.2 /100 | #270 | Tragic $90,581 |
| Iroquois | 0.2 /100 | #271 | Tragic $90,543 |
| Immigrants | Liberia | 0.2 /100 | #272 | Tragic $90,450 |
| Immigrants | Micronesia | 0.2 /100 | #273 | Tragic $90,345 |
| Spanish Americans | 0.2 /100 | #274 | Tragic $90,322 |
| Immigrants | St. Vincent and the Grenadines | 0.2 /100 | #275 | Tragic $90,094 |
Demographics Similar to Bermudans by Median Family Income
In terms of median family income, the demographic groups most similar to Bermudans are Immigrants from Armenia ($97,605, a difference of 0.030%), Nigerian ($97,522, a difference of 0.060%), Panamanian ($97,683, a difference of 0.11%), Immigrants from Bosnia and Herzegovina ($97,432, a difference of 0.15%), and Immigrants from Sudan ($97,737, a difference of 0.16%).
| Demographics | Rating | Rank | Median Family Income |
| Aleuts | 11.6 /100 | #207 | Poor $98,702 |
| Immigrants | Uruguay | 9.2 /100 | #208 | Tragic $98,205 |
| Immigrants | Colombia | 8.7 /100 | #209 | Tragic $98,067 |
| Puget Sound Salish | 8.2 /100 | #210 | Tragic $97,958 |
| Immigrants | Sudan | 7.4 /100 | #211 | Tragic $97,737 |
| Panamanians | 7.2 /100 | #212 | Tragic $97,683 |
| Immigrants | Armenia | 7.0 /100 | #213 | Tragic $97,605 |
| Bermudans | 6.9 /100 | #214 | Tragic $97,577 |
| Nigerians | 6.7 /100 | #215 | Tragic $97,522 |
| Immigrants | Bosnia and Herzegovina | 6.4 /100 | #216 | Tragic $97,432 |
| Japanese | 6.0 /100 | #217 | Tragic $97,288 |
| Immigrants | Cambodia | 5.8 /100 | #218 | Tragic $97,222 |
| Delaware | 5.1 /100 | #219 | Tragic $96,958 |
| Sudanese | 4.7 /100 | #220 | Tragic $96,783 |
| Immigrants | Ghana | 4.2 /100 | #221 | Tragic $96,544 |