Cree vs Immigrants from Ecuador Hearing Disability
COMPARE
Cree
Immigrants from Ecuador
Hearing Disability
Hearing Disability Comparison
Cree
Immigrants from Ecuador
3.8%
HEARING DISABILITY
0.0/ 100
METRIC RATING
310th/ 347
METRIC RANK
2.5%
HEARING DISABILITY
99.9/ 100
METRIC RATING
10th/ 347
METRIC RANK
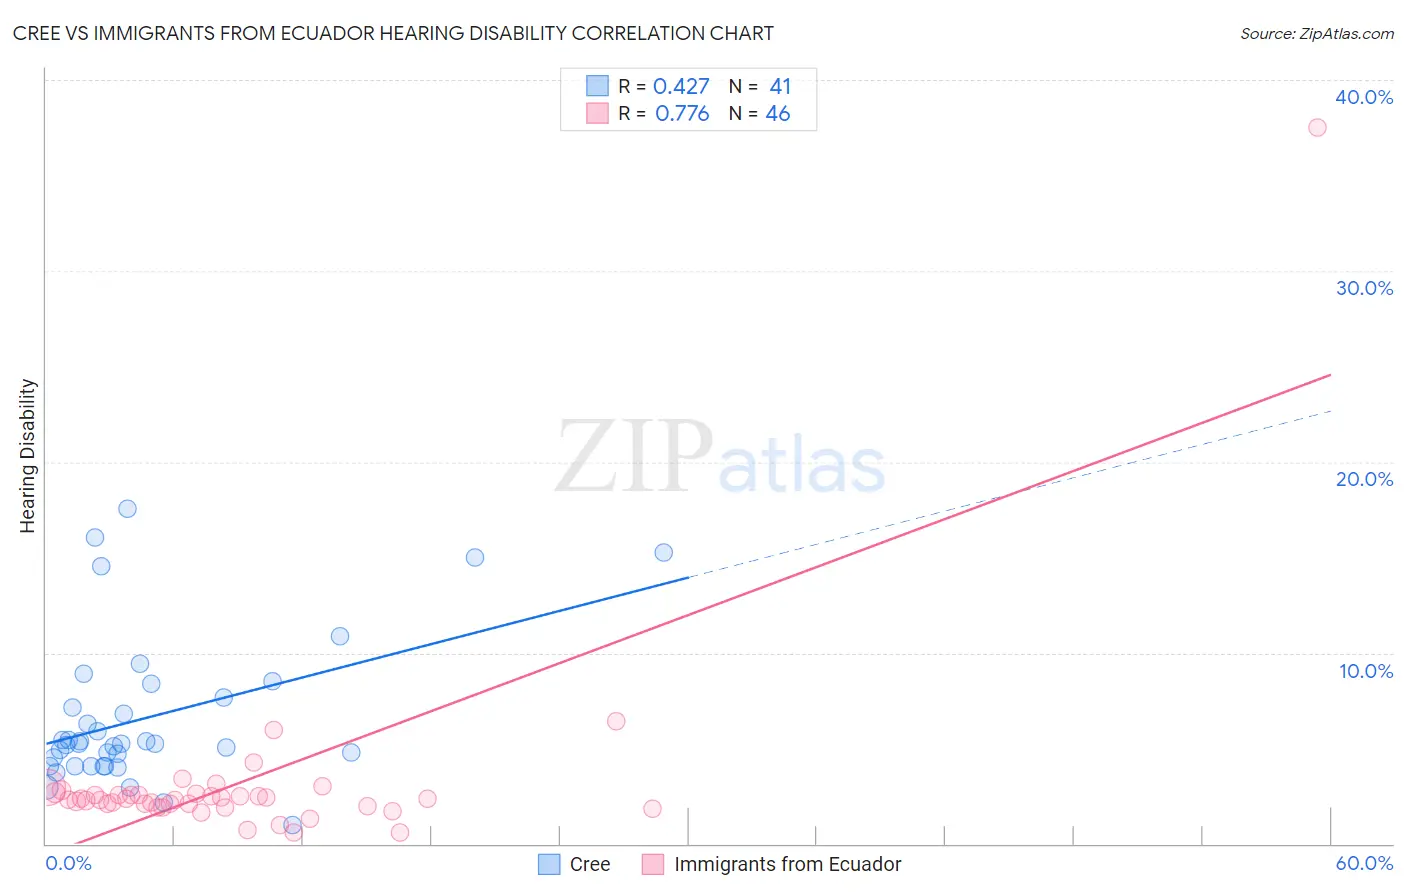
Cree vs Immigrants from Ecuador Hearing Disability Correlation Chart
The statistical analysis conducted on geographies consisting of 76,207,567 people shows a moderate positive correlation between the proportion of Cree and percentage of population with hearing disability in the United States with a correlation coefficient (R) of 0.427 and weighted average of 3.8%. Similarly, the statistical analysis conducted on geographies consisting of 270,917,145 people shows a strong positive correlation between the proportion of Immigrants from Ecuador and percentage of population with hearing disability in the United States with a correlation coefficient (R) of 0.776 and weighted average of 2.5%, a difference of 55.3%.
Hearing Disability Correlation Summary
| Measurement | Cree | Immigrants from Ecuador |
| Minimum | 0.96% | 0.57% |
| Maximum | 17.6% | 37.5% |
| Range | 16.6% | 36.9% |
| Mean | 6.6% | 3.2% |
| Median | 5.2% | 2.3% |
| Interquartile 25% (IQ1) | 4.1% | 2.0% |
| Interquartile 75% (IQ3) | 8.0% | 2.6% |
| Interquartile Range (IQR) | 4.0% | 0.59% |
| Standard Deviation (Sample) | 3.9% | 5.3% |
| Standard Deviation (Population) | 3.9% | 5.2% |
Similar Demographics by Hearing Disability
Demographics Similar to Cree by Hearing Disability
In terms of hearing disability, the demographic groups most similar to Cree are Scotch-Irish (3.8%, a difference of 0.31%), Ottawa (3.8%, a difference of 0.39%), French Canadian (3.8%, a difference of 0.83%), Marshallese (3.8%, a difference of 0.95%), and American (3.9%, a difference of 1.3%).
| Demographics | Rating | Rank | Hearing Disability |
| Menominee | 0.0 /100 | #303 | Tragic 3.7% |
| French | 0.0 /100 | #304 | Tragic 3.8% |
| English | 0.0 /100 | #305 | Tragic 3.8% |
| Marshallese | 0.0 /100 | #306 | Tragic 3.8% |
| French Canadians | 0.0 /100 | #307 | Tragic 3.8% |
| Ottawa | 0.0 /100 | #308 | Tragic 3.8% |
| Scotch-Irish | 0.0 /100 | #309 | Tragic 3.8% |
| Cree | 0.0 /100 | #310 | Tragic 3.8% |
| Americans | 0.0 /100 | #311 | Tragic 3.9% |
| Cajuns | 0.0 /100 | #312 | Tragic 3.9% |
| Hopi | 0.0 /100 | #313 | Tragic 3.9% |
| Yakama | 0.0 /100 | #314 | Tragic 3.9% |
| Puget Sound Salish | 0.0 /100 | #315 | Tragic 3.9% |
| Spanish Americans | 0.0 /100 | #316 | Tragic 4.0% |
| Comanche | 0.0 /100 | #317 | Tragic 4.0% |
Demographics Similar to Immigrants from Ecuador by Hearing Disability
In terms of hearing disability, the demographic groups most similar to Immigrants from Ecuador are Immigrants from Trinidad and Tobago (2.5%, a difference of 0.55%), Trinidadian and Tobagonian (2.5%, a difference of 0.86%), Immigrants from Dominican Republic (2.4%, a difference of 1.0%), Sierra Leonean (2.5%, a difference of 1.1%), and Ecuadorian (2.5%, a difference of 1.4%).
| Demographics | Rating | Rank | Hearing Disability |
| Guyanese | 100.0 /100 | #3 | Exceptional 2.3% |
| Immigrants | Guyana | 100.0 /100 | #4 | Exceptional 2.3% |
| Immigrants | Barbados | 100.0 /100 | #5 | Exceptional 2.4% |
| Vietnamese | 100.0 /100 | #6 | Exceptional 2.4% |
| Immigrants | Bangladesh | 100.0 /100 | #7 | Exceptional 2.4% |
| British West Indians | 100.0 /100 | #8 | Exceptional 2.4% |
| Immigrants | Dominican Republic | 100.0 /100 | #9 | Exceptional 2.4% |
| Immigrants | Ecuador | 99.9 /100 | #10 | Exceptional 2.5% |
| Immigrants | Trinidad and Tobago | 99.9 /100 | #11 | Exceptional 2.5% |
| Trinidadians and Tobagonians | 99.9 /100 | #12 | Exceptional 2.5% |
| Sierra Leoneans | 99.9 /100 | #13 | Exceptional 2.5% |
| Ecuadorians | 99.9 /100 | #14 | Exceptional 2.5% |
| Barbadians | 99.9 /100 | #15 | Exceptional 2.5% |
| Immigrants | West Indies | 99.9 /100 | #16 | Exceptional 2.5% |
| Immigrants | India | 99.9 /100 | #17 | Exceptional 2.5% |