Cree vs Immigrants from Dominica Median Family Income
COMPARE
Cree
Immigrants from Dominica
Median Family Income
Median Family Income Comparison
Cree
Immigrants from Dominica
$90,882
MEDIAN FAMILY INCOME
0.2/ 100
METRIC RATING
268th/ 347
METRIC RANK
$85,411
MEDIAN FAMILY INCOME
0.0/ 100
METRIC RATING
306th/ 347
METRIC RANK
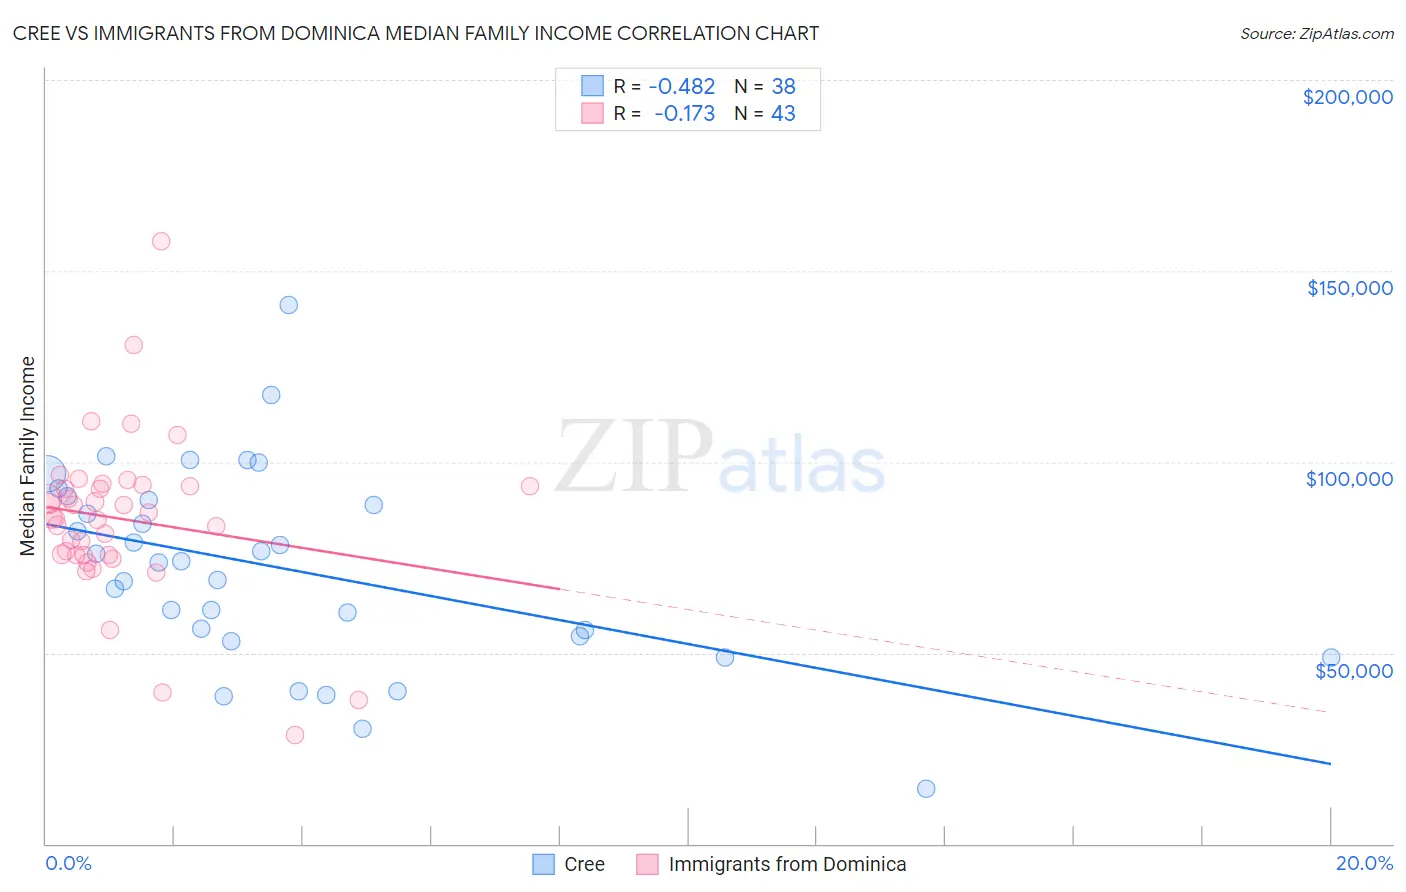
Cree vs Immigrants from Dominica Median Family Income Correlation Chart
The statistical analysis conducted on geographies consisting of 76,200,070 people shows a moderate negative correlation between the proportion of Cree and median family income in the United States with a correlation coefficient (R) of -0.482 and weighted average of $90,882. Similarly, the statistical analysis conducted on geographies consisting of 83,779,139 people shows a poor negative correlation between the proportion of Immigrants from Dominica and median family income in the United States with a correlation coefficient (R) of -0.173 and weighted average of $85,411, a difference of 6.4%.
Median Family Income Correlation Summary
| Measurement | Cree | Immigrants from Dominica |
| Minimum | $14,519 | $28,616 |
| Maximum | $140,987 | $157,838 |
| Range | $126,468 | $129,222 |
| Mean | $71,996 | $84,989 |
| Median | $73,827 | $85,349 |
| Interquartile 25% (IQ1) | $54,375 | $75,527 |
| Interquartile 75% (IQ3) | $90,158 | $93,750 |
| Interquartile Range (IQR) | $35,783 | $18,223 |
| Standard Deviation (Sample) | $25,840 | $21,651 |
| Standard Deviation (Population) | $25,498 | $21,398 |
Similar Demographics by Median Family Income
Demographics Similar to Cree by Median Family Income
In terms of median family income, the demographic groups most similar to Cree are Belizean ($90,880, a difference of 0.0%), Mexican American Indian ($90,918, a difference of 0.040%), Central American ($91,087, a difference of 0.23%), Jamaican ($90,581, a difference of 0.33%), and Iroquois ($90,543, a difference of 0.37%).
| Demographics | Rating | Rank | Median Family Income |
| Inupiat | 0.4 /100 | #261 | Tragic $91,730 |
| Liberians | 0.4 /100 | #262 | Tragic $91,722 |
| Immigrants | West Indies | 0.3 /100 | #263 | Tragic $91,588 |
| Senegalese | 0.3 /100 | #264 | Tragic $91,475 |
| Hmong | 0.3 /100 | #265 | Tragic $91,296 |
| Central Americans | 0.3 /100 | #266 | Tragic $91,087 |
| Mexican American Indians | 0.2 /100 | #267 | Tragic $90,918 |
| Cree | 0.2 /100 | #268 | Tragic $90,882 |
| Belizeans | 0.2 /100 | #269 | Tragic $90,880 |
| Jamaicans | 0.2 /100 | #270 | Tragic $90,581 |
| Iroquois | 0.2 /100 | #271 | Tragic $90,543 |
| Immigrants | Liberia | 0.2 /100 | #272 | Tragic $90,450 |
| Immigrants | Micronesia | 0.2 /100 | #273 | Tragic $90,345 |
| Spanish Americans | 0.2 /100 | #274 | Tragic $90,322 |
| Immigrants | St. Vincent and the Grenadines | 0.2 /100 | #275 | Tragic $90,094 |
Demographics Similar to Immigrants from Dominica by Median Family Income
In terms of median family income, the demographic groups most similar to Immigrants from Dominica are Paiute ($85,414, a difference of 0.0%), Chickasaw ($85,356, a difference of 0.060%), U.S. Virgin Islander ($85,294, a difference of 0.14%), Haitian ($85,218, a difference of 0.23%), and Mexican ($85,618, a difference of 0.24%).
| Demographics | Rating | Rank | Median Family Income |
| Chippewa | 0.0 /100 | #299 | Tragic $86,852 |
| Ottawa | 0.0 /100 | #300 | Tragic $86,380 |
| Colville | 0.0 /100 | #301 | Tragic $85,792 |
| Spanish American Indians | 0.0 /100 | #302 | Tragic $85,728 |
| Hispanics or Latinos | 0.0 /100 | #303 | Tragic $85,647 |
| Mexicans | 0.0 /100 | #304 | Tragic $85,618 |
| Paiute | 0.0 /100 | #305 | Tragic $85,414 |
| Immigrants | Dominica | 0.0 /100 | #306 | Tragic $85,411 |
| Chickasaw | 0.0 /100 | #307 | Tragic $85,356 |
| U.S. Virgin Islanders | 0.0 /100 | #308 | Tragic $85,294 |
| Haitians | 0.0 /100 | #309 | Tragic $85,218 |
| Immigrants | Central America | 0.0 /100 | #310 | Tragic $85,050 |
| Hondurans | 0.0 /100 | #311 | Tragic $85,004 |
| Cubans | 0.0 /100 | #312 | Tragic $84,981 |
| Choctaw | 0.0 /100 | #313 | Tragic $84,835 |