Cree vs Immigrants from Ecuador High School Diploma
COMPARE
Cree
Immigrants from Ecuador
High School Diploma
High School Diploma Comparison
Cree
Immigrants from Ecuador
89.3%
HIGH SCHOOL DIPLOMA
61.1/ 100
METRIC RATING
163rd/ 347
METRIC RANK
84.8%
HIGH SCHOOL DIPLOMA
0.0/ 100
METRIC RATING
313th/ 347
METRIC RANK
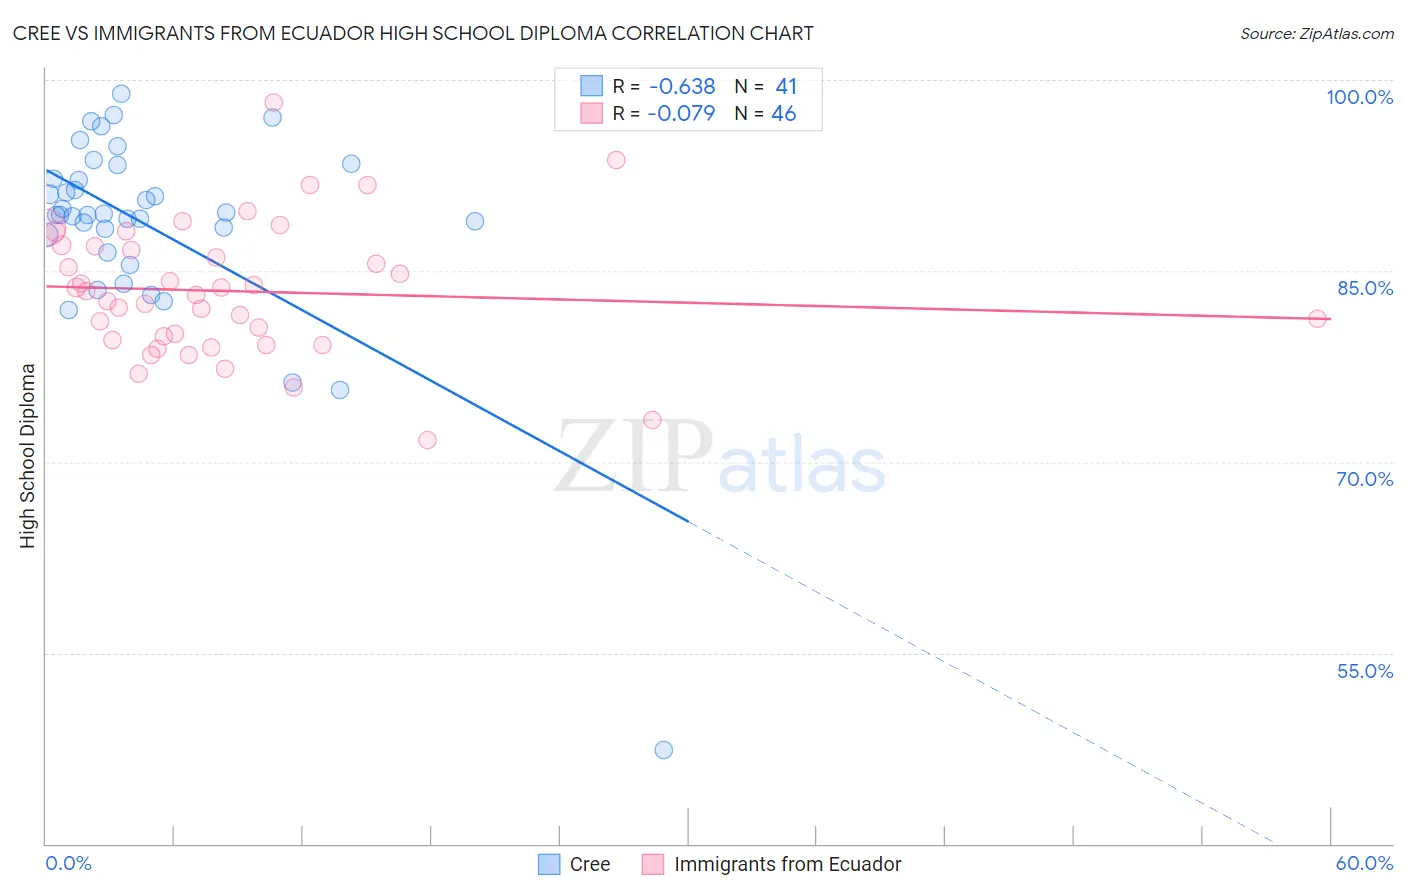
Cree vs Immigrants from Ecuador High School Diploma Correlation Chart
The statistical analysis conducted on geographies consisting of 76,211,744 people shows a significant negative correlation between the proportion of Cree and percentage of population with at least high school diploma education in the United States with a correlation coefficient (R) of -0.638 and weighted average of 89.3%. Similarly, the statistical analysis conducted on geographies consisting of 270,907,929 people shows a slight negative correlation between the proportion of Immigrants from Ecuador and percentage of population with at least high school diploma education in the United States with a correlation coefficient (R) of -0.079 and weighted average of 84.8%, a difference of 5.3%.
High School Diploma Correlation Summary
| Measurement | Cree | Immigrants from Ecuador |
| Minimum | 47.4% | 71.7% |
| Maximum | 98.9% | 98.2% |
| Range | 51.6% | 26.5% |
| Mean | 88.5% | 83.4% |
| Median | 89.4% | 83.3% |
| Interquartile 25% (IQ1) | 87.1% | 79.6% |
| Interquartile 75% (IQ3) | 92.8% | 86.9% |
| Interquartile Range (IQR) | 5.7% | 7.3% |
| Standard Deviation (Sample) | 8.3% | 5.3% |
| Standard Deviation (Population) | 8.2% | 5.2% |
Similar Demographics by High School Diploma
Demographics Similar to Cree by High School Diploma
In terms of high school diploma, the demographic groups most similar to Cree are Brazilian (89.3%, a difference of 0.0%), Bermudan (89.3%, a difference of 0.0%), Immigrants from Nepal (89.3%, a difference of 0.0%), Immigrants from China (89.3%, a difference of 0.010%), and Laotian (89.3%, a difference of 0.010%).
| Demographics | Rating | Rank | High School Diploma |
| Immigrants | Argentina | 65.5 /100 | #156 | Good 89.4% |
| Immigrants | Malaysia | 63.5 /100 | #157 | Good 89.3% |
| Immigrants | Pakistan | 62.5 /100 | #158 | Good 89.3% |
| Immigrants | China | 62.0 /100 | #159 | Good 89.3% |
| Laotians | 61.8 /100 | #160 | Good 89.3% |
| Brazilians | 61.2 /100 | #161 | Good 89.3% |
| Bermudans | 61.1 /100 | #162 | Good 89.3% |
| Cree | 61.1 /100 | #163 | Good 89.3% |
| Immigrants | Nepal | 61.1 /100 | #164 | Good 89.3% |
| Immigrants | Asia | 59.8 /100 | #165 | Average 89.3% |
| Immigrants | Albania | 59.4 /100 | #166 | Average 89.3% |
| Immigrants | Hong Kong | 58.6 /100 | #167 | Average 89.3% |
| Delaware | 55.8 /100 | #168 | Average 89.2% |
| Iroquois | 55.1 /100 | #169 | Average 89.2% |
| Immigrants | Morocco | 53.3 /100 | #170 | Average 89.2% |
Demographics Similar to Immigrants from Ecuador by High School Diploma
In terms of high school diploma, the demographic groups most similar to Immigrants from Ecuador are Yaqui (84.7%, a difference of 0.11%), Puerto Rican (84.7%, a difference of 0.20%), Cape Verdean (85.1%, a difference of 0.26%), Ecuadorian (85.1%, a difference of 0.31%), and Apache (85.1%, a difference of 0.32%).
| Demographics | Rating | Rank | High School Diploma |
| Immigrants | Guyana | 0.0 /100 | #306 | Tragic 85.3% |
| Navajo | 0.0 /100 | #307 | Tragic 85.2% |
| Immigrants | Armenia | 0.0 /100 | #308 | Tragic 85.2% |
| Immigrants | Dominica | 0.0 /100 | #309 | Tragic 85.2% |
| Apache | 0.0 /100 | #310 | Tragic 85.1% |
| Ecuadorians | 0.0 /100 | #311 | Tragic 85.1% |
| Cape Verdeans | 0.0 /100 | #312 | Tragic 85.1% |
| Immigrants | Ecuador | 0.0 /100 | #313 | Tragic 84.8% |
| Yaqui | 0.0 /100 | #314 | Tragic 84.7% |
| Puerto Ricans | 0.0 /100 | #315 | Tragic 84.7% |
| Belizeans | 0.0 /100 | #316 | Tragic 84.3% |
| Immigrants | Caribbean | 0.0 /100 | #317 | Tragic 84.3% |
| Immigrants | Belize | 0.0 /100 | #318 | Tragic 84.2% |
| Central American Indians | 0.0 /100 | #319 | Tragic 84.2% |
| Nicaraguans | 0.0 /100 | #320 | Tragic 84.1% |