Mongolian vs Comanche Median Female Earnings
COMPARE
Mongolian
Comanche
Median Female Earnings
Median Female Earnings Comparison
Mongolians
Comanche
$42,542
MEDIAN FEMALE EARNINGS
99.7/ 100
METRIC RATING
73rd/ 347
METRIC RANK
$35,661
MEDIAN FEMALE EARNINGS
0.0/ 100
METRIC RATING
295th/ 347
METRIC RANK
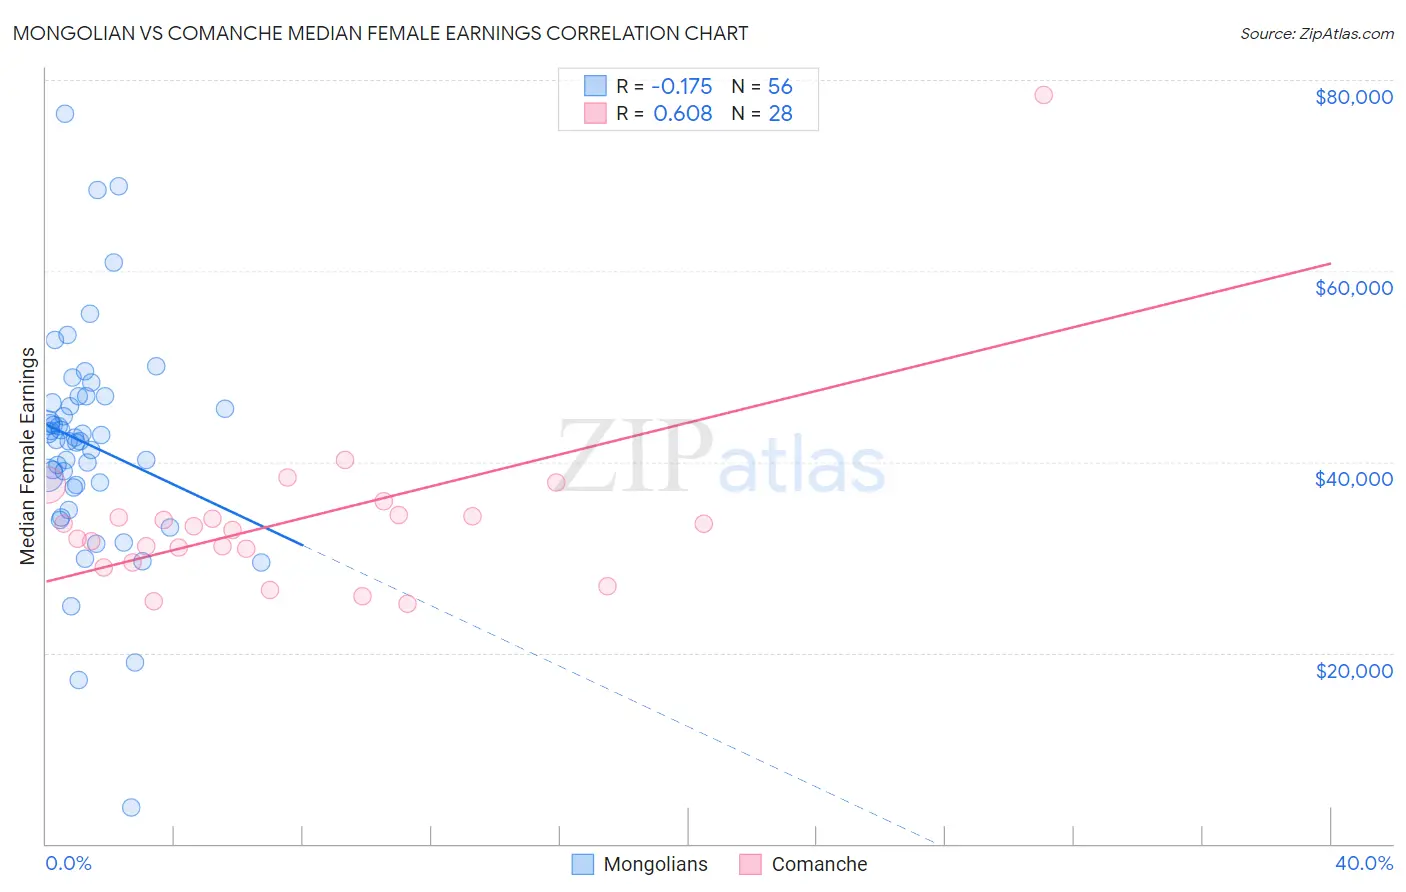
Mongolian vs Comanche Median Female Earnings Correlation Chart
The statistical analysis conducted on geographies consisting of 140,350,842 people shows a poor negative correlation between the proportion of Mongolians and median female earnings in the United States with a correlation coefficient (R) of -0.175 and weighted average of $42,542. Similarly, the statistical analysis conducted on geographies consisting of 109,756,357 people shows a significant positive correlation between the proportion of Comanche and median female earnings in the United States with a correlation coefficient (R) of 0.608 and weighted average of $35,661, a difference of 19.3%.
Median Female Earnings Correlation Summary
| Measurement | Mongolian | Comanche |
| Minimum | $3,764 | $25,100 |
| Maximum | $76,486 | $78,452 |
| Range | $72,722 | $53,352 |
| Mean | $41,823 | $33,877 |
| Median | $42,408 | $33,076 |
| Interquartile 25% (IQ1) | $37,469 | $30,131 |
| Interquartile 75% (IQ3) | $46,493 | $34,372 |
| Interquartile Range (IQR) | $9,024 | $4,241 |
| Standard Deviation (Sample) | $11,821 | $9,585 |
| Standard Deviation (Population) | $11,715 | $9,413 |
Similar Demographics by Median Female Earnings
Demographics Similar to Mongolians by Median Female Earnings
In terms of median female earnings, the demographic groups most similar to Mongolians are Immigrants from South Africa ($42,508, a difference of 0.080%), Albanian ($42,584, a difference of 0.10%), New Zealander ($42,446, a difference of 0.23%), Immigrants from Italy ($42,446, a difference of 0.23%), and Immigrants from Albania ($42,388, a difference of 0.36%).
| Demographics | Rating | Rank | Median Female Earnings |
| Immigrants | Norway | 99.9 /100 | #66 | Exceptional $42,837 |
| Immigrants | Egypt | 99.9 /100 | #67 | Exceptional $42,837 |
| Immigrants | Austria | 99.8 /100 | #68 | Exceptional $42,824 |
| Immigrants | Spain | 99.8 /100 | #69 | Exceptional $42,815 |
| Immigrants | Ethiopia | 99.8 /100 | #70 | Exceptional $42,744 |
| Immigrants | Romania | 99.8 /100 | #71 | Exceptional $42,718 |
| Albanians | 99.8 /100 | #72 | Exceptional $42,584 |
| Mongolians | 99.7 /100 | #73 | Exceptional $42,542 |
| Immigrants | South Africa | 99.7 /100 | #74 | Exceptional $42,508 |
| New Zealanders | 99.7 /100 | #75 | Exceptional $42,446 |
| Immigrants | Italy | 99.7 /100 | #76 | Exceptional $42,446 |
| Immigrants | Albania | 99.6 /100 | #77 | Exceptional $42,388 |
| Immigrants | Kazakhstan | 99.6 /100 | #78 | Exceptional $42,386 |
| Greeks | 99.6 /100 | #79 | Exceptional $42,336 |
| Immigrants | Moldova | 99.6 /100 | #80 | Exceptional $42,304 |
Demographics Similar to Comanche by Median Female Earnings
In terms of median female earnings, the demographic groups most similar to Comanche are Cheyenne ($35,673, a difference of 0.030%), Guatemalan ($35,695, a difference of 0.090%), Mexican American Indian ($35,629, a difference of 0.090%), American ($35,777, a difference of 0.32%), and Hmong ($35,498, a difference of 0.46%).
| Demographics | Rating | Rank | Median Female Earnings |
| Immigrants | Zaire | 0.0 /100 | #288 | Tragic $36,017 |
| Bangladeshis | 0.0 /100 | #289 | Tragic $35,960 |
| Central American Indians | 0.0 /100 | #290 | Tragic $35,930 |
| Blackfeet | 0.0 /100 | #291 | Tragic $35,864 |
| Americans | 0.0 /100 | #292 | Tragic $35,777 |
| Guatemalans | 0.0 /100 | #293 | Tragic $35,695 |
| Cheyenne | 0.0 /100 | #294 | Tragic $35,673 |
| Comanche | 0.0 /100 | #295 | Tragic $35,661 |
| Mexican American Indians | 0.0 /100 | #296 | Tragic $35,629 |
| Hmong | 0.0 /100 | #297 | Tragic $35,498 |
| Immigrants | Micronesia | 0.0 /100 | #298 | Tragic $35,477 |
| Immigrants | Guatemala | 0.0 /100 | #299 | Tragic $35,444 |
| Yuman | 0.0 /100 | #300 | Tragic $35,377 |
| Pima | 0.0 /100 | #301 | Tragic $35,326 |
| Blacks/African Americans | 0.0 /100 | #302 | Tragic $35,315 |