Shoshone vs Comanche Median Female Earnings
COMPARE
Shoshone
Comanche
Median Female Earnings
Median Female Earnings Comparison
Shoshone
Comanche
$34,677
MEDIAN FEMALE EARNINGS
0.0/ 100
METRIC RATING
319th/ 347
METRIC RANK
$35,661
MEDIAN FEMALE EARNINGS
0.0/ 100
METRIC RATING
295th/ 347
METRIC RANK
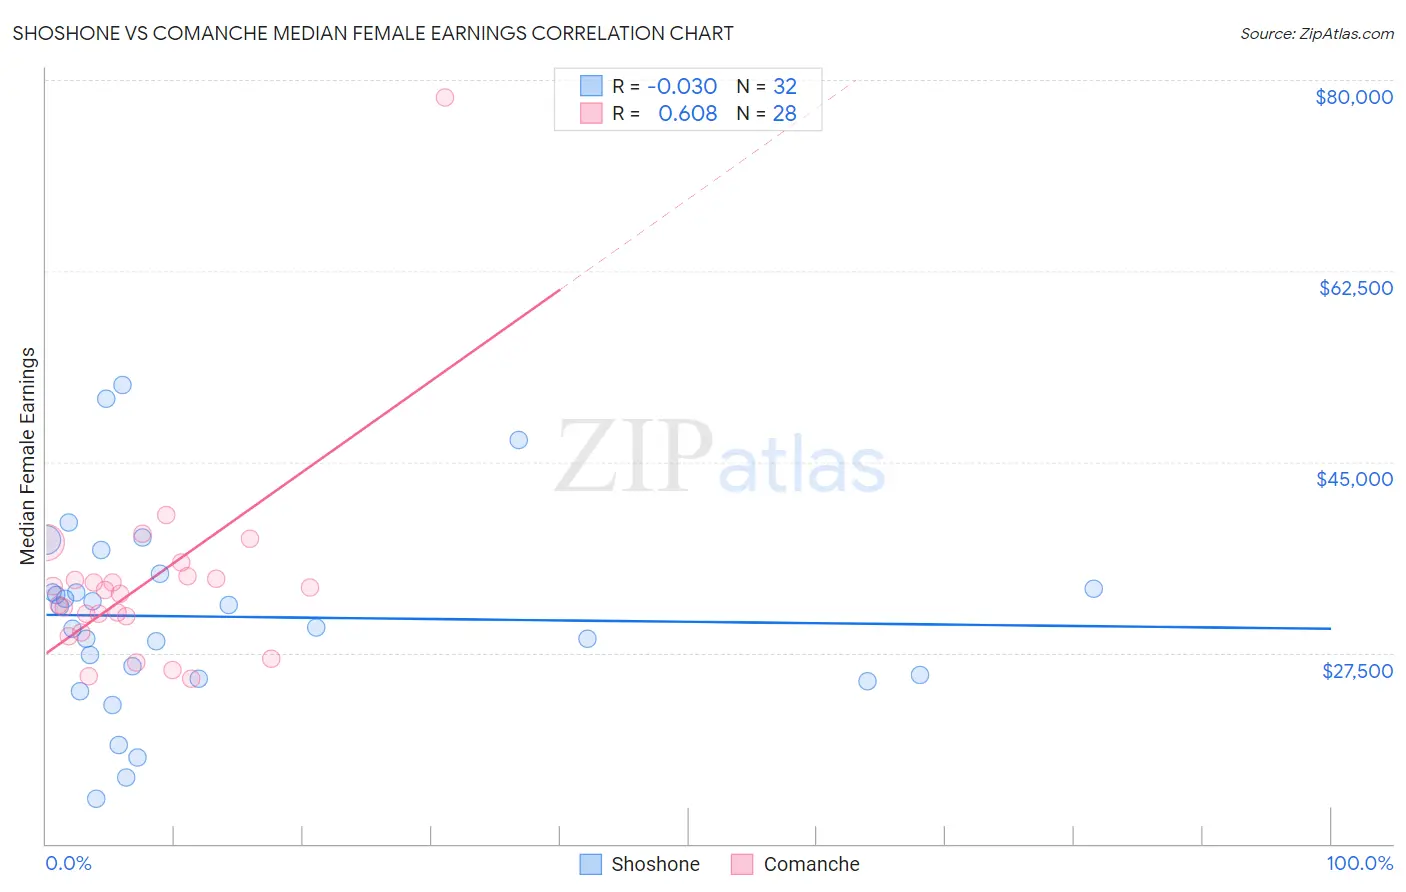
Shoshone vs Comanche Median Female Earnings Correlation Chart
The statistical analysis conducted on geographies consisting of 66,610,433 people shows no correlation between the proportion of Shoshone and median female earnings in the United States with a correlation coefficient (R) of -0.030 and weighted average of $34,677. Similarly, the statistical analysis conducted on geographies consisting of 109,756,357 people shows a significant positive correlation between the proportion of Comanche and median female earnings in the United States with a correlation coefficient (R) of 0.608 and weighted average of $35,661, a difference of 2.8%.
Median Female Earnings Correlation Summary
| Measurement | Shoshone | Comanche |
| Minimum | $14,091 | $25,100 |
| Maximum | $52,089 | $78,452 |
| Range | $37,998 | $53,352 |
| Mean | $30,807 | $33,877 |
| Median | $30,799 | $33,076 |
| Interquartile 25% (IQ1) | $25,287 | $30,131 |
| Interquartile 75% (IQ3) | $34,049 | $34,372 |
| Interquartile Range (IQR) | $8,762 | $4,241 |
| Standard Deviation (Sample) | $8,852 | $9,585 |
| Standard Deviation (Population) | $8,713 | $9,413 |
Similar Demographics by Median Female Earnings
Demographics Similar to Shoshone by Median Female Earnings
In terms of median female earnings, the demographic groups most similar to Shoshone are Immigrants from Yemen ($34,693, a difference of 0.050%), Immigrants from Honduras ($34,647, a difference of 0.090%), Potawatomi ($34,739, a difference of 0.18%), Cherokee ($34,742, a difference of 0.19%), and Pennsylvania German ($34,802, a difference of 0.36%).
| Demographics | Rating | Rank | Median Female Earnings |
| Yaqui | 0.0 /100 | #312 | Tragic $34,943 |
| Cubans | 0.0 /100 | #313 | Tragic $34,942 |
| Apache | 0.0 /100 | #314 | Tragic $34,895 |
| Pennsylvania Germans | 0.0 /100 | #315 | Tragic $34,802 |
| Cherokee | 0.0 /100 | #316 | Tragic $34,742 |
| Potawatomi | 0.0 /100 | #317 | Tragic $34,739 |
| Immigrants | Yemen | 0.0 /100 | #318 | Tragic $34,693 |
| Shoshone | 0.0 /100 | #319 | Tragic $34,677 |
| Immigrants | Honduras | 0.0 /100 | #320 | Tragic $34,647 |
| Hispanics or Latinos | 0.0 /100 | #321 | Tragic $34,421 |
| Chickasaw | 0.0 /100 | #322 | Tragic $34,414 |
| Seminole | 0.0 /100 | #323 | Tragic $34,385 |
| Immigrants | Congo | 0.0 /100 | #324 | Tragic $34,317 |
| Dutch West Indians | 0.0 /100 | #325 | Tragic $34,106 |
| Kiowa | 0.0 /100 | #326 | Tragic $34,074 |
Demographics Similar to Comanche by Median Female Earnings
In terms of median female earnings, the demographic groups most similar to Comanche are Cheyenne ($35,673, a difference of 0.030%), Guatemalan ($35,695, a difference of 0.090%), Mexican American Indian ($35,629, a difference of 0.090%), American ($35,777, a difference of 0.32%), and Hmong ($35,498, a difference of 0.46%).
| Demographics | Rating | Rank | Median Female Earnings |
| Immigrants | Zaire | 0.0 /100 | #288 | Tragic $36,017 |
| Bangladeshis | 0.0 /100 | #289 | Tragic $35,960 |
| Central American Indians | 0.0 /100 | #290 | Tragic $35,930 |
| Blackfeet | 0.0 /100 | #291 | Tragic $35,864 |
| Americans | 0.0 /100 | #292 | Tragic $35,777 |
| Guatemalans | 0.0 /100 | #293 | Tragic $35,695 |
| Cheyenne | 0.0 /100 | #294 | Tragic $35,673 |
| Comanche | 0.0 /100 | #295 | Tragic $35,661 |
| Mexican American Indians | 0.0 /100 | #296 | Tragic $35,629 |
| Hmong | 0.0 /100 | #297 | Tragic $35,498 |
| Immigrants | Micronesia | 0.0 /100 | #298 | Tragic $35,477 |
| Immigrants | Guatemala | 0.0 /100 | #299 | Tragic $35,444 |
| Yuman | 0.0 /100 | #300 | Tragic $35,377 |
| Pima | 0.0 /100 | #301 | Tragic $35,326 |
| Blacks/African Americans | 0.0 /100 | #302 | Tragic $35,315 |